 3
3peptides
spectra
0.000 | 0.000
0.000 | 0.000
0.048 | 0.105
0.166 | 0.371
0.000 | 0.000
0.114 | 0.349
0.381 | 0.417
0.000 | 0.000
1peptide
spectra
NA | NA
NA | NA
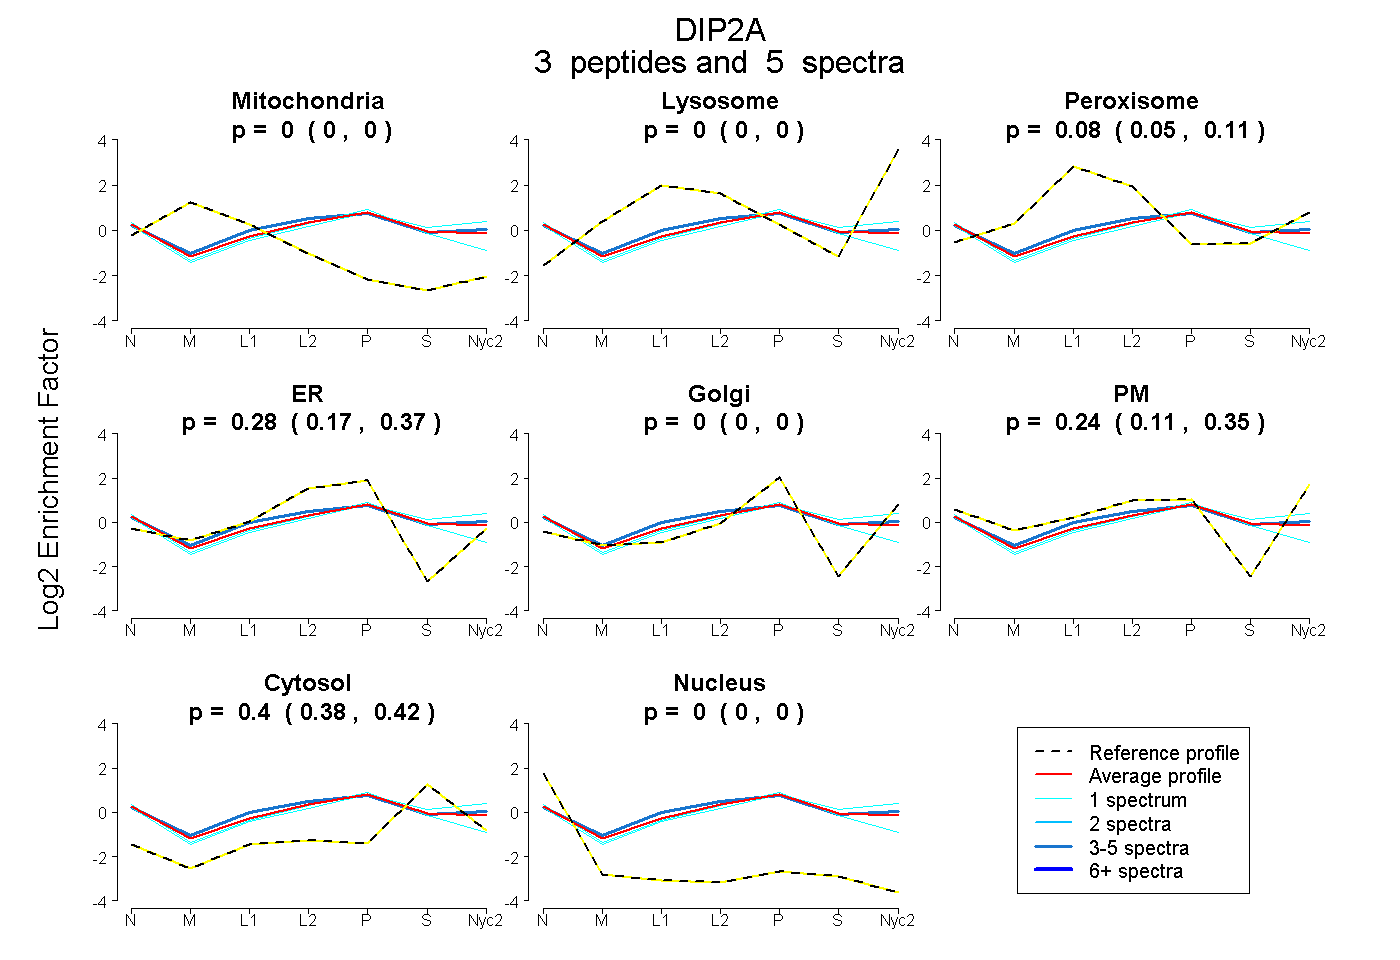
| Plot | Mito | Lyso | Perox | ER | Golgi | PM | Cytosol | Nucleus | |||||
| Expt A |
3 peptides |
5 spectra |
|
0.000 0.000 | 0.000 |
0.000 0.000 | 0.000 |
0.079 0.048 | 0.105 |
0.281 0.166 | 0.371 |
0.000 0.000 | 0.000 |
0.239 0.114 | 0.349 |
0.401 0.381 | 0.417 |
0.000 0.000 | 0.000 |
||
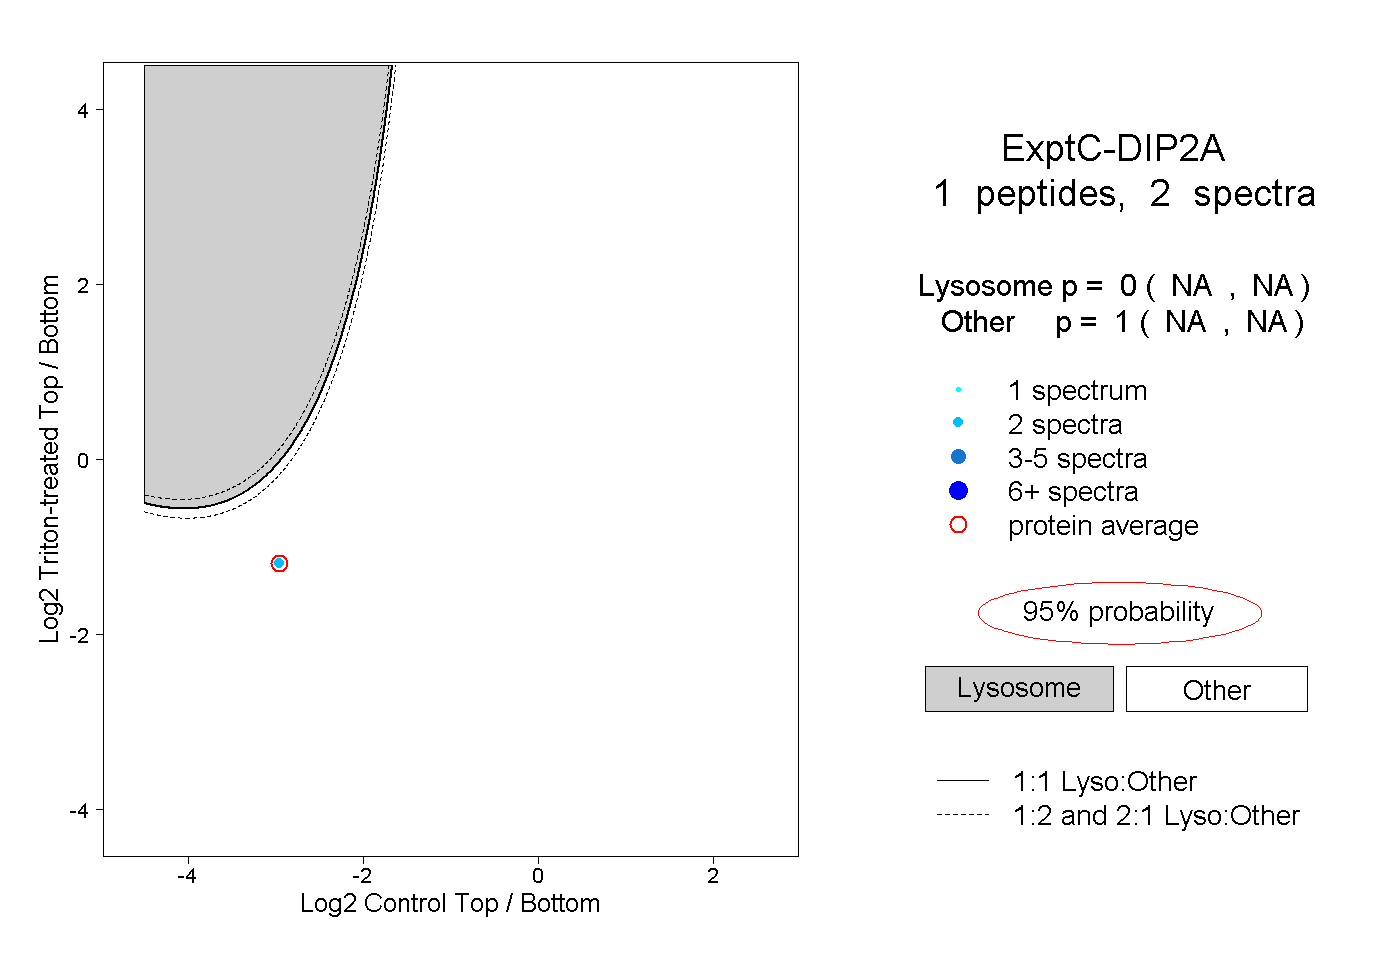
| Plot | Lyso | Other | |||||||||||
| Expt C |
1 peptide |
2 spectra |
|
0.000 NA | NA |
1.000 NA | NA |