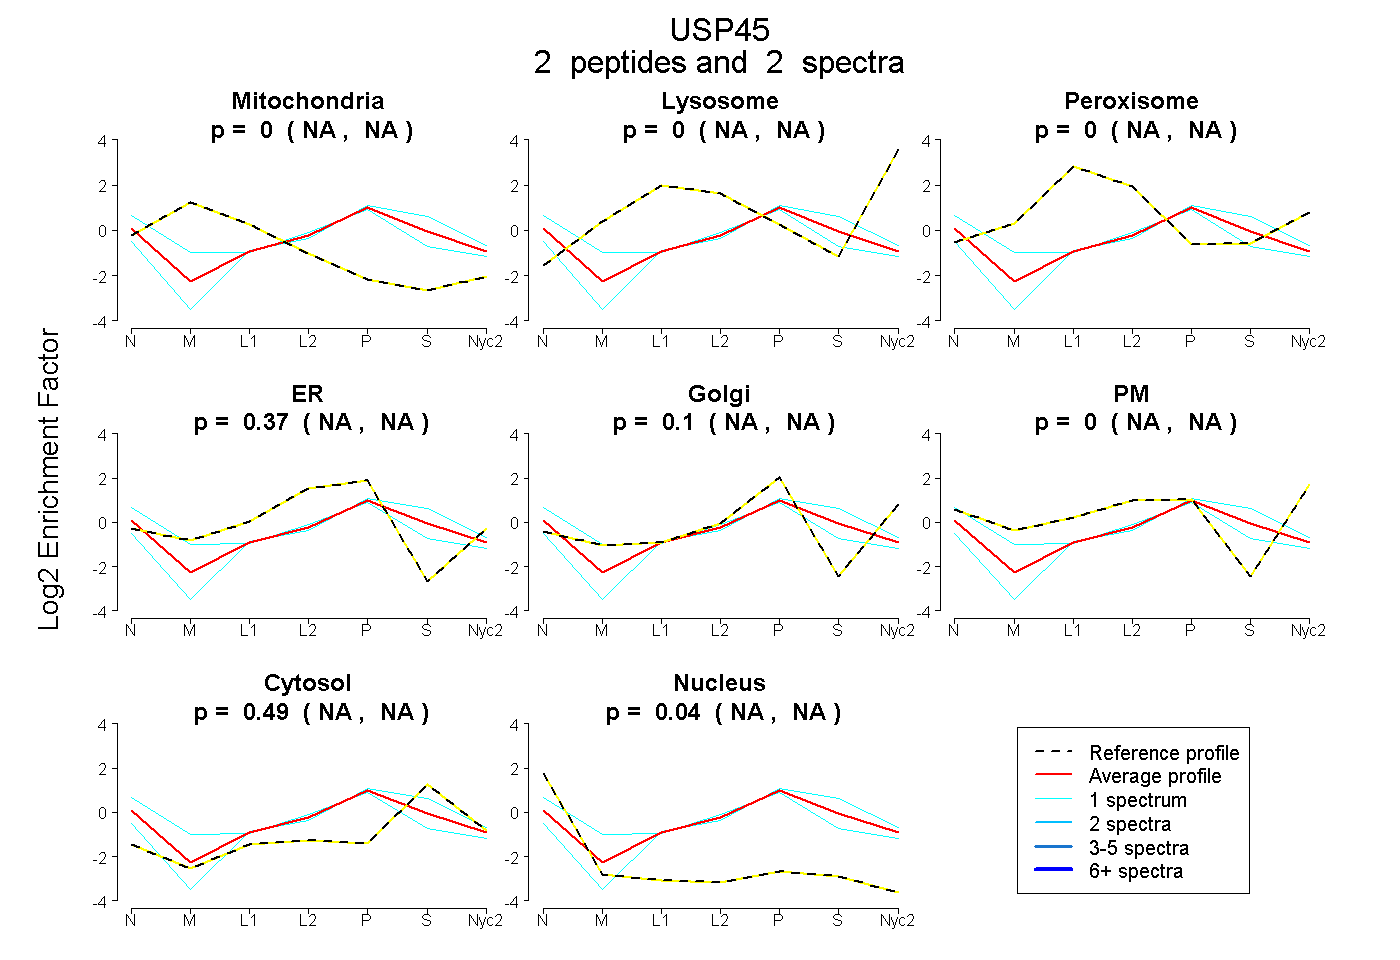
 2
2peptides
spectra
NA | NA
NA | NA
NA | NA
NA | NA
NA | NA
NA | NA
NA | NA
NA | NA
| Plot | Mito | Lyso | Perox | ER | Golgi | PM | Cytosol | Nucleus | |||||
| Expt A |
2 peptides |
2 spectra |
|
0.000 NA | NA |
0.000 NA | NA |
0.000 NA | NA |
0.369 NA | NA |
0.100 NA | NA |
0.000 NA | NA |
0.489 NA | NA |
0.042 NA | NA |
| 1 spectrum, SLQETDQDHNK | 0.000 | 0.000 | 0.000 | 0.209 | 0.143 | 0.000 | 0.648 | 0.000 | ||
| 1 spectrum, LCEEK | 0.000 | 0.000 | 0.000 | 0.509 | 0.003 | 0.061 | 0.282 | 0.145 |
| Plot | Lyso | Other | |||||||||||
| Expt C |
3 peptides |
4 spectra |
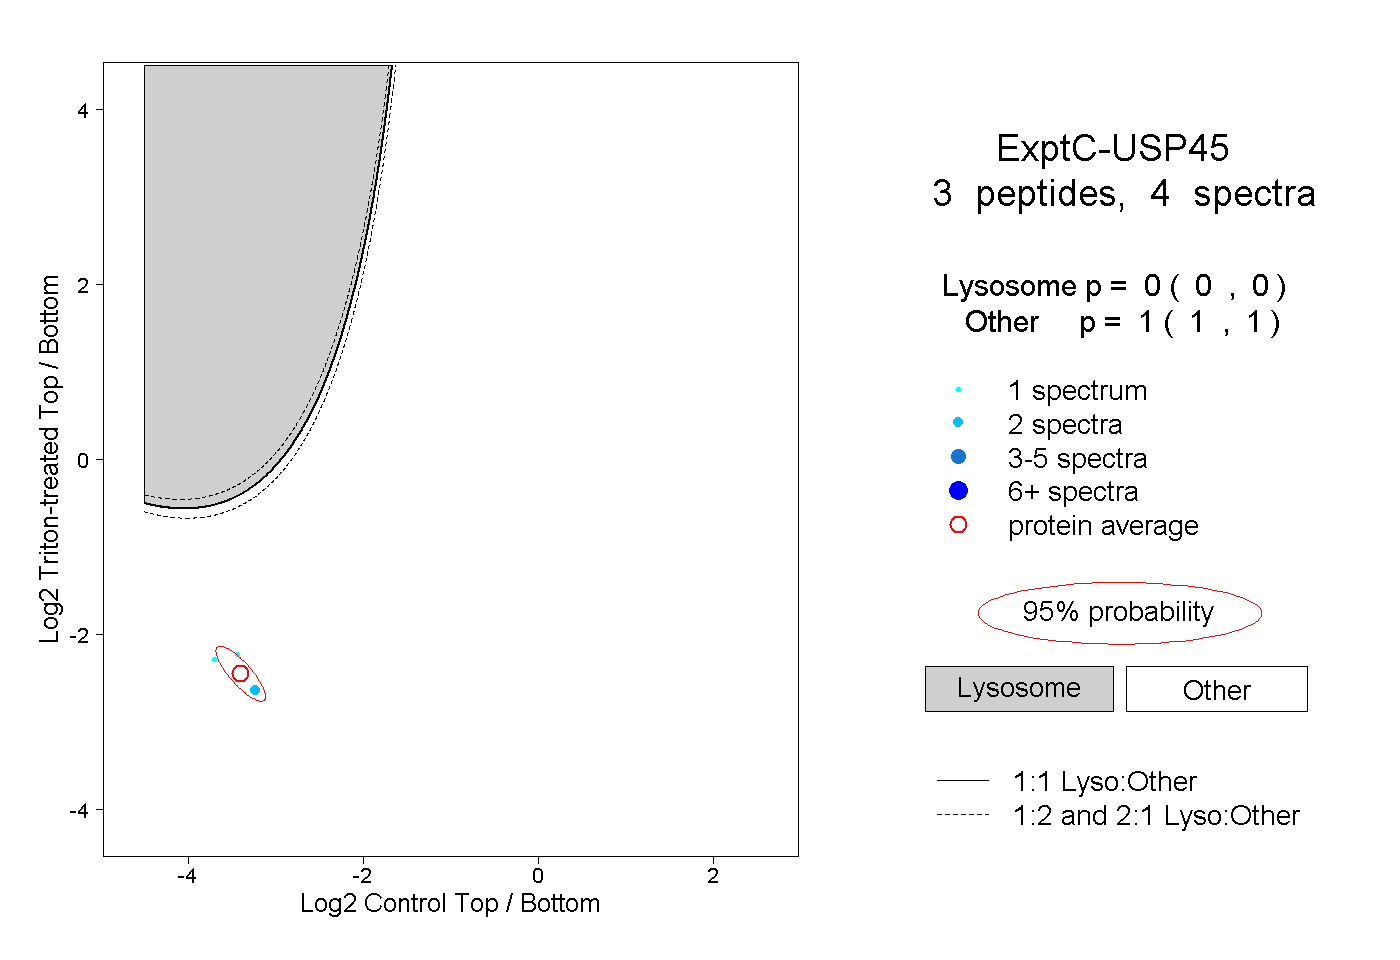 |
0.000 0.000 | 0.000 |
1.000 1.000 | 1.000 |