 2
2peptides
spectra
0.000 | 0.231
0.000 | 0.000
0.000 | 0.000
0.156 | 0.381
0.000 | 0.056
0.000 | 0.000
0.453 | 0.607
0.000 | 0.170
2peptides
spectra
0.000 | 0.000
1.000 | 1.000
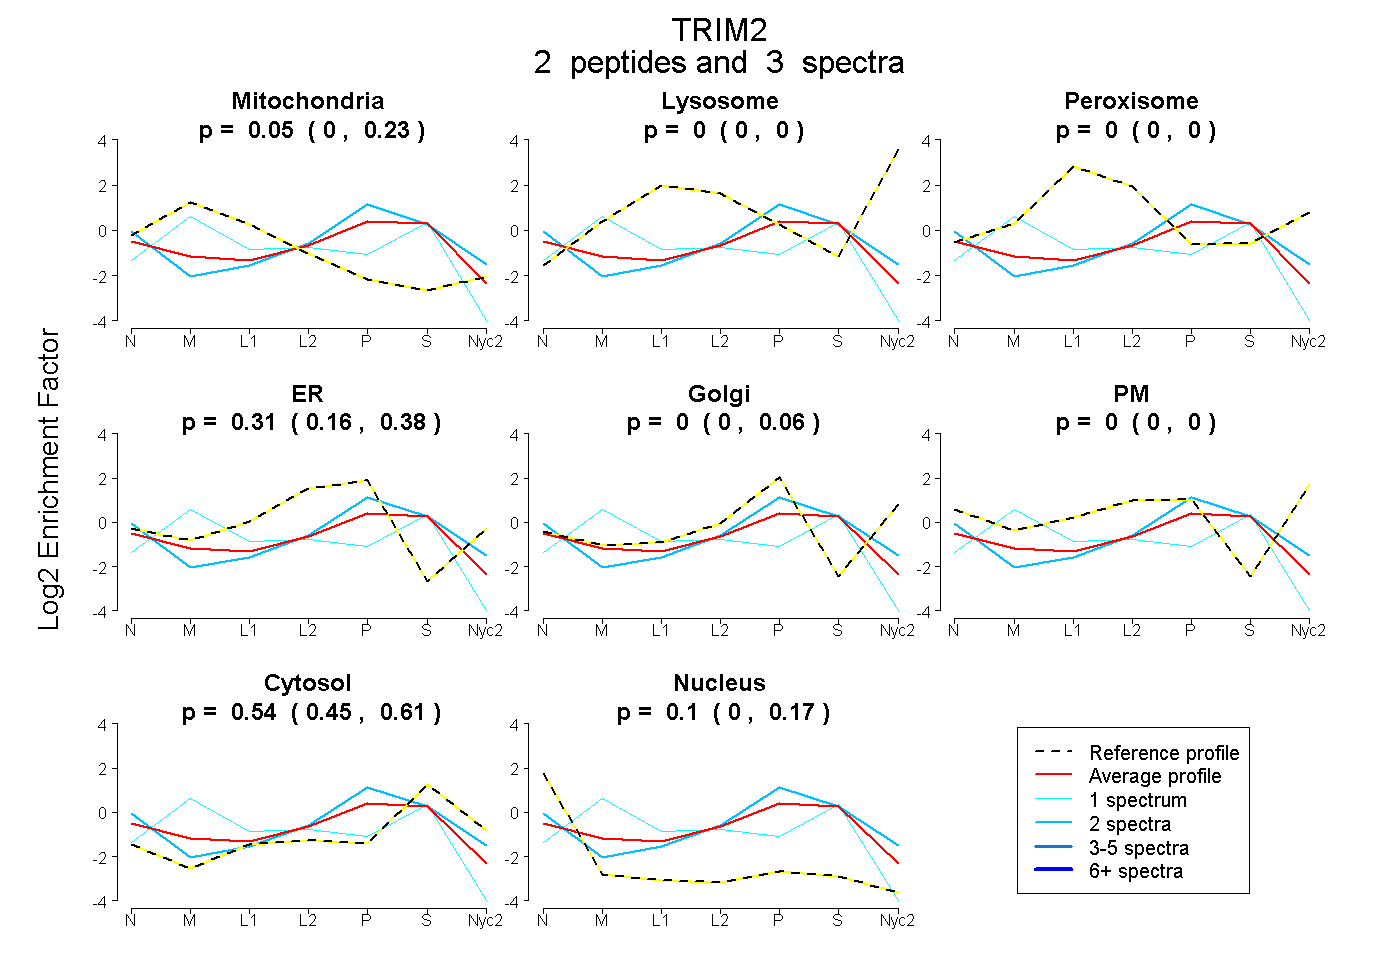
| Plot | Mito | Lyso | Perox | ER | Golgi | PM | Cytosol | Nucleus | |||||
| Expt A |
2 peptides |
3 spectra |
|
0.047 0.000 | 0.231 |
0.000 0.000 | 0.000 |
0.000 0.000 | 0.000 |
0.307 0.156 | 0.381 |
0.000 0.000 | 0.056 |
0.000 0.000 | 0.000 |
0.542 0.453 | 0.607 |
0.105 0.000 | 0.170 |
||
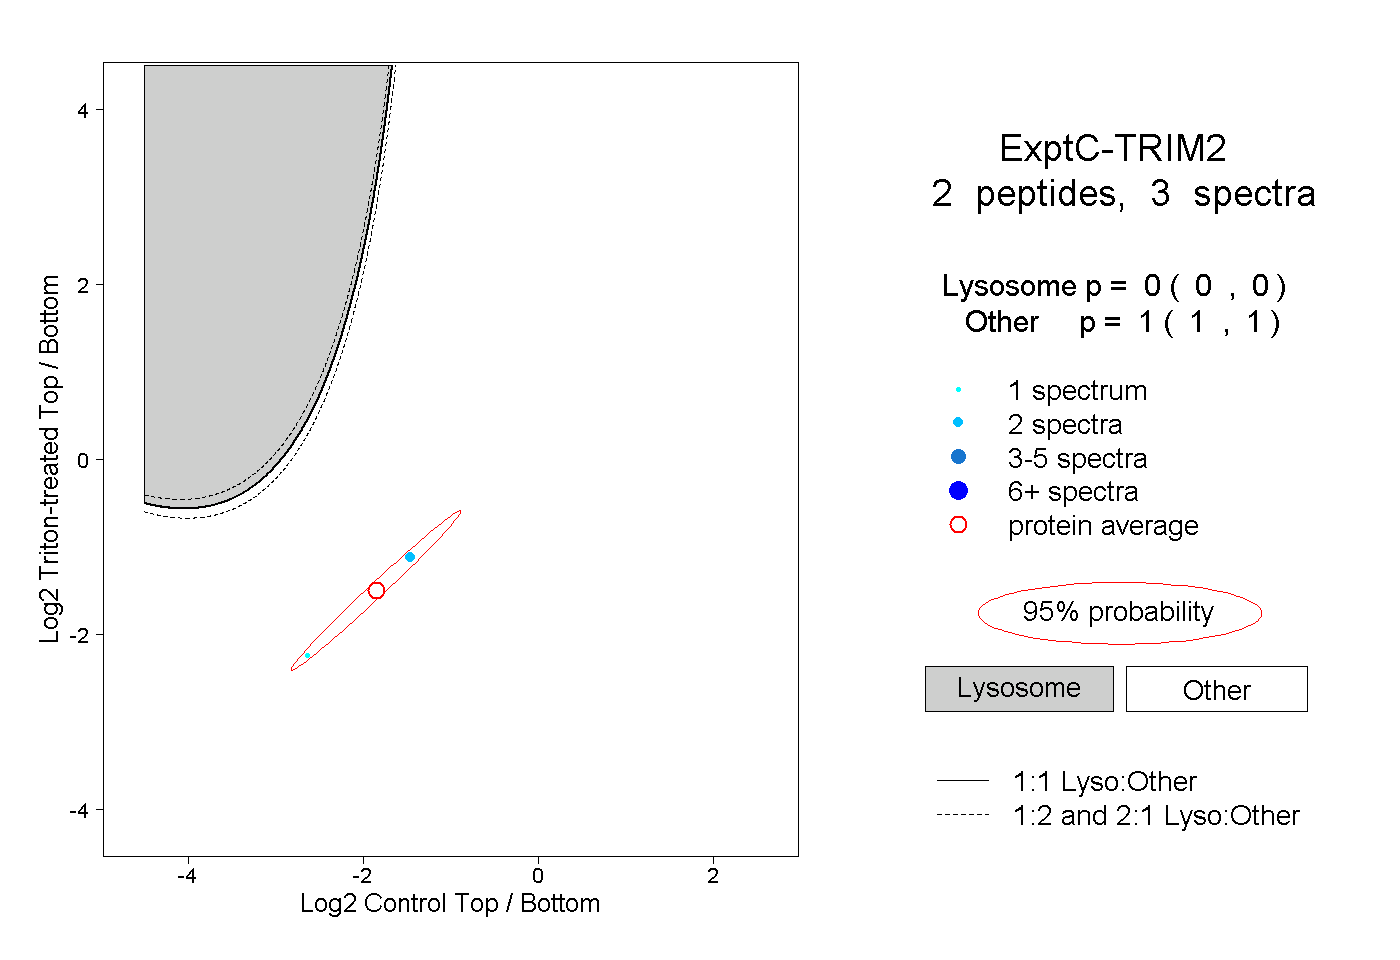
| Plot | Lyso | Other | |||||||||||
| Expt C |
2 peptides |
3 spectra |
|
0.000 0.000 | 0.000 |
1.000 1.000 | 1.000 |