 1
1peptide
spectra
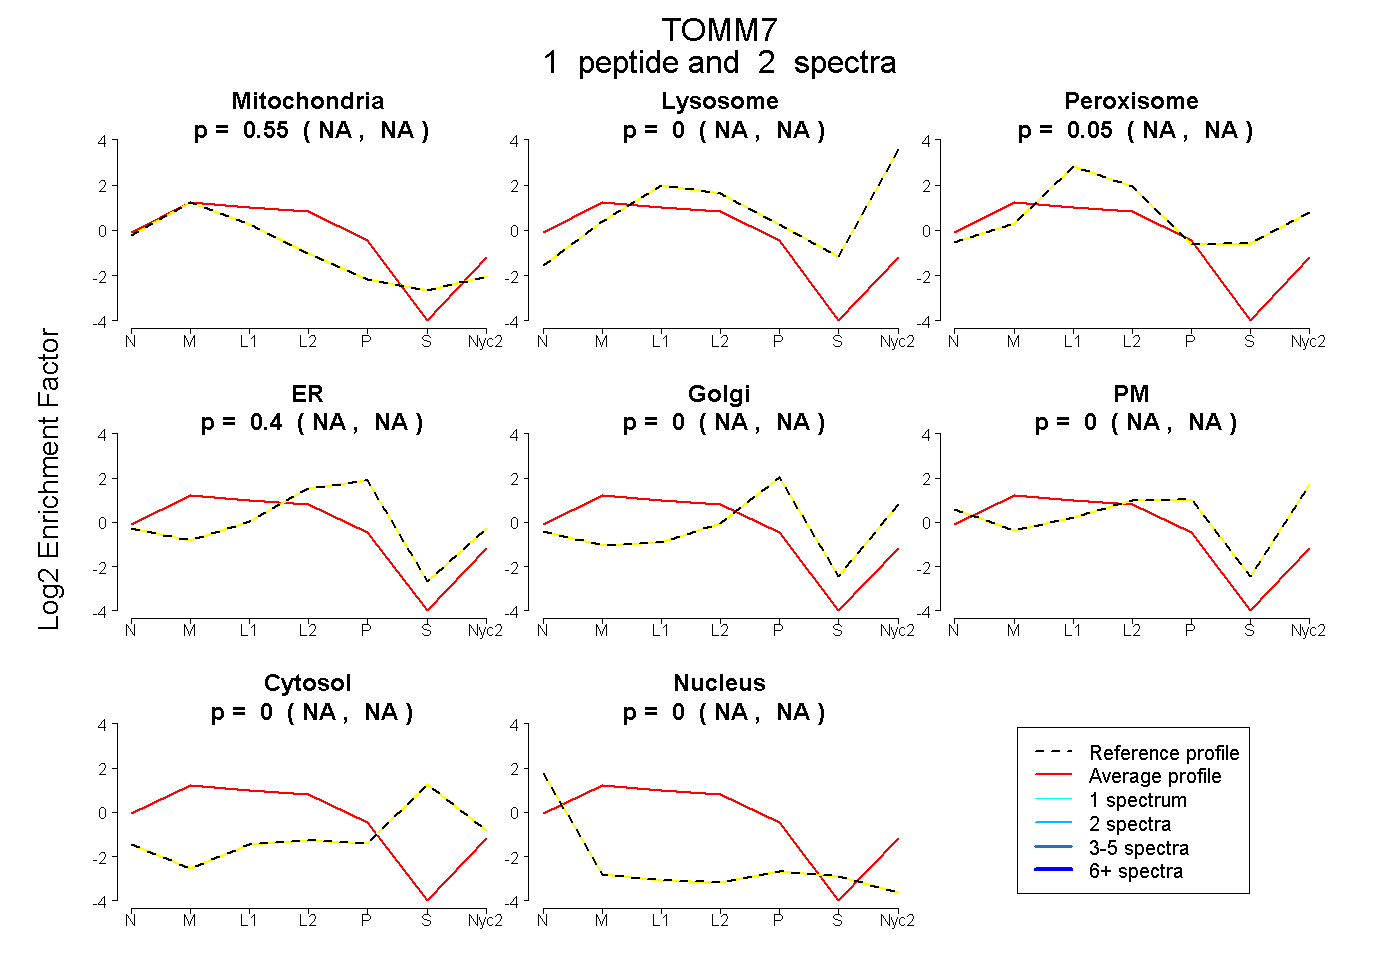
NA | NA
NA | NA
NA | NA
NA | NA
NA | NA
NA | NA
NA | NA
NA | NA
2peptides
spectra
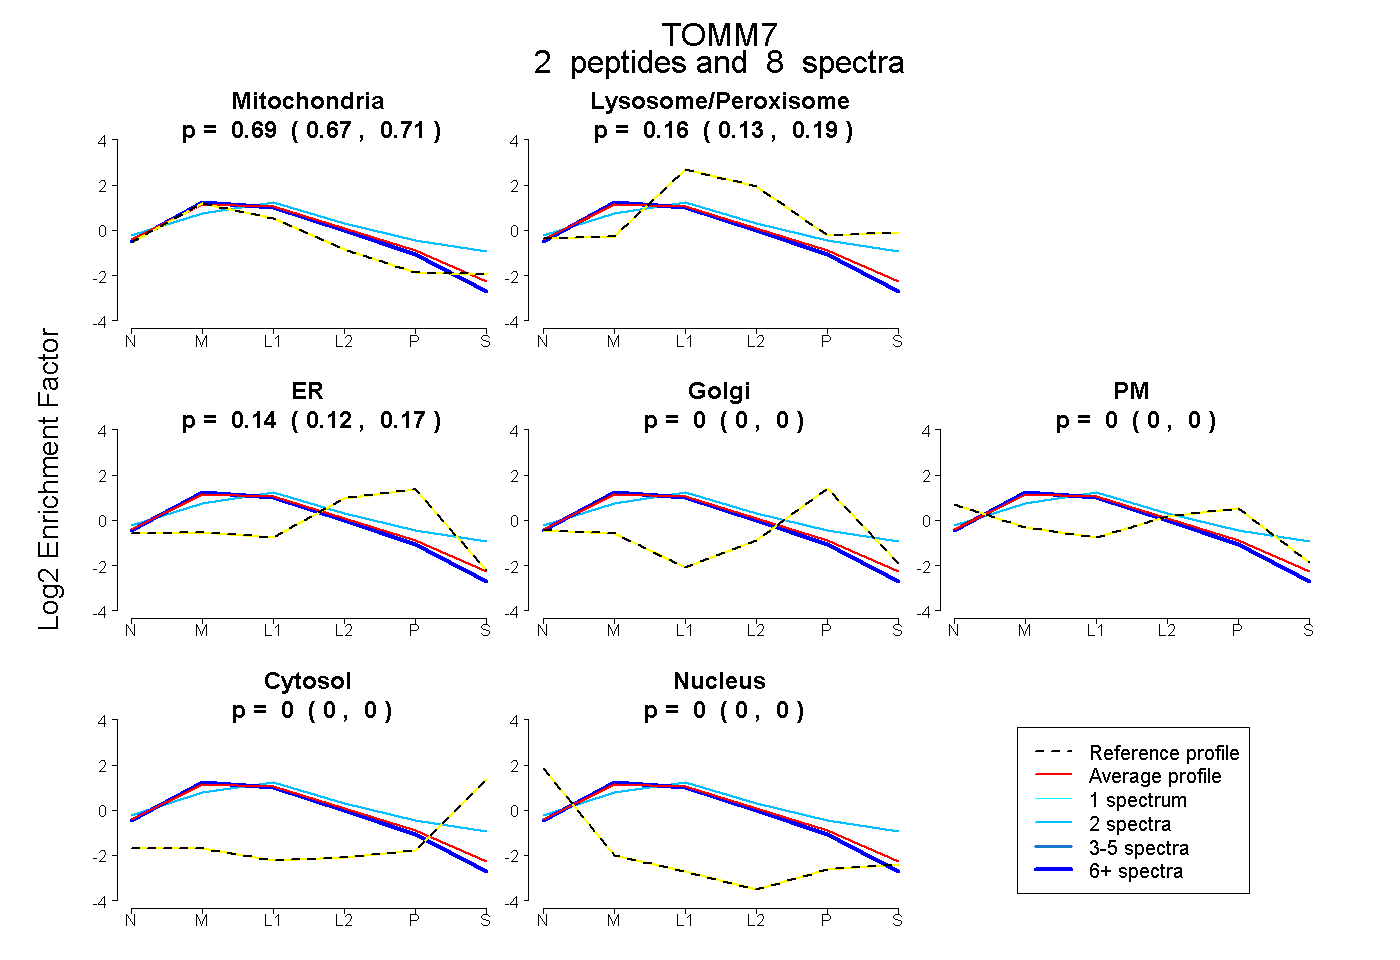
0.668 | 0.711
0.130 | 0.188
0.117 | 0.168
0.000 | 0.000
0.000 | 0.000
0.000 | 0.000
0.000 | 0.000
2peptides
spectra
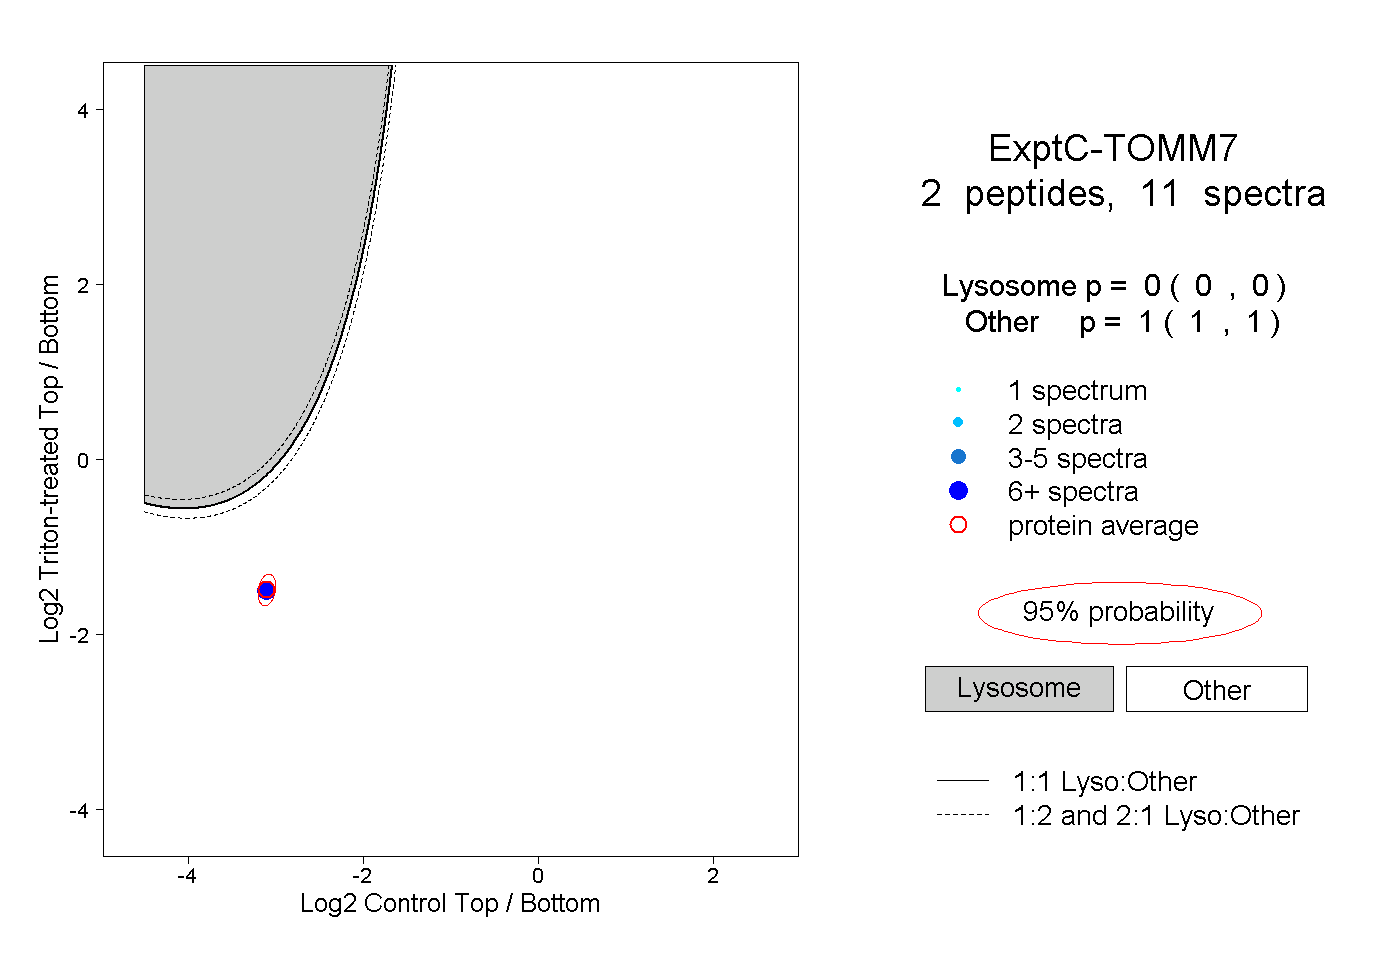
0.000 | 0.000
1.000 | 1.000
2peptides
spectra
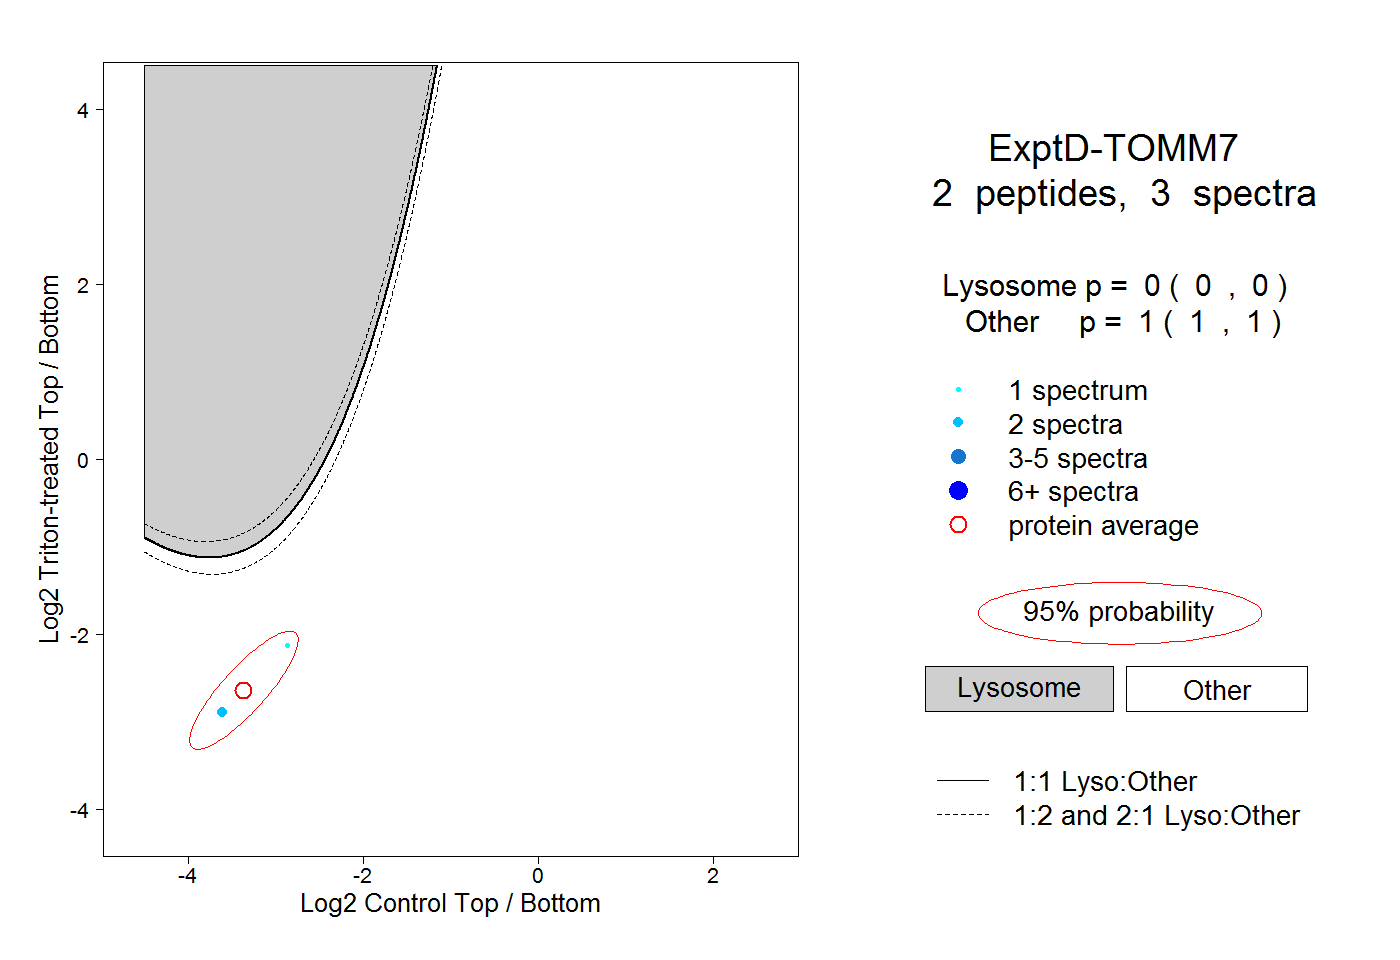
0.000 | 0.000
1.000 | 1.000