 2
2peptides
spectra
0.443 | 0.556
0.000 | 0.073
0.044 | 0.241
0.000 | 0.059
0.000 | 0.072
0.190 | 0.348
0.000 | 0.000
0.000 | 0.000
6peptides
spectra
0.000 | 0.000
1.000 | 1.000
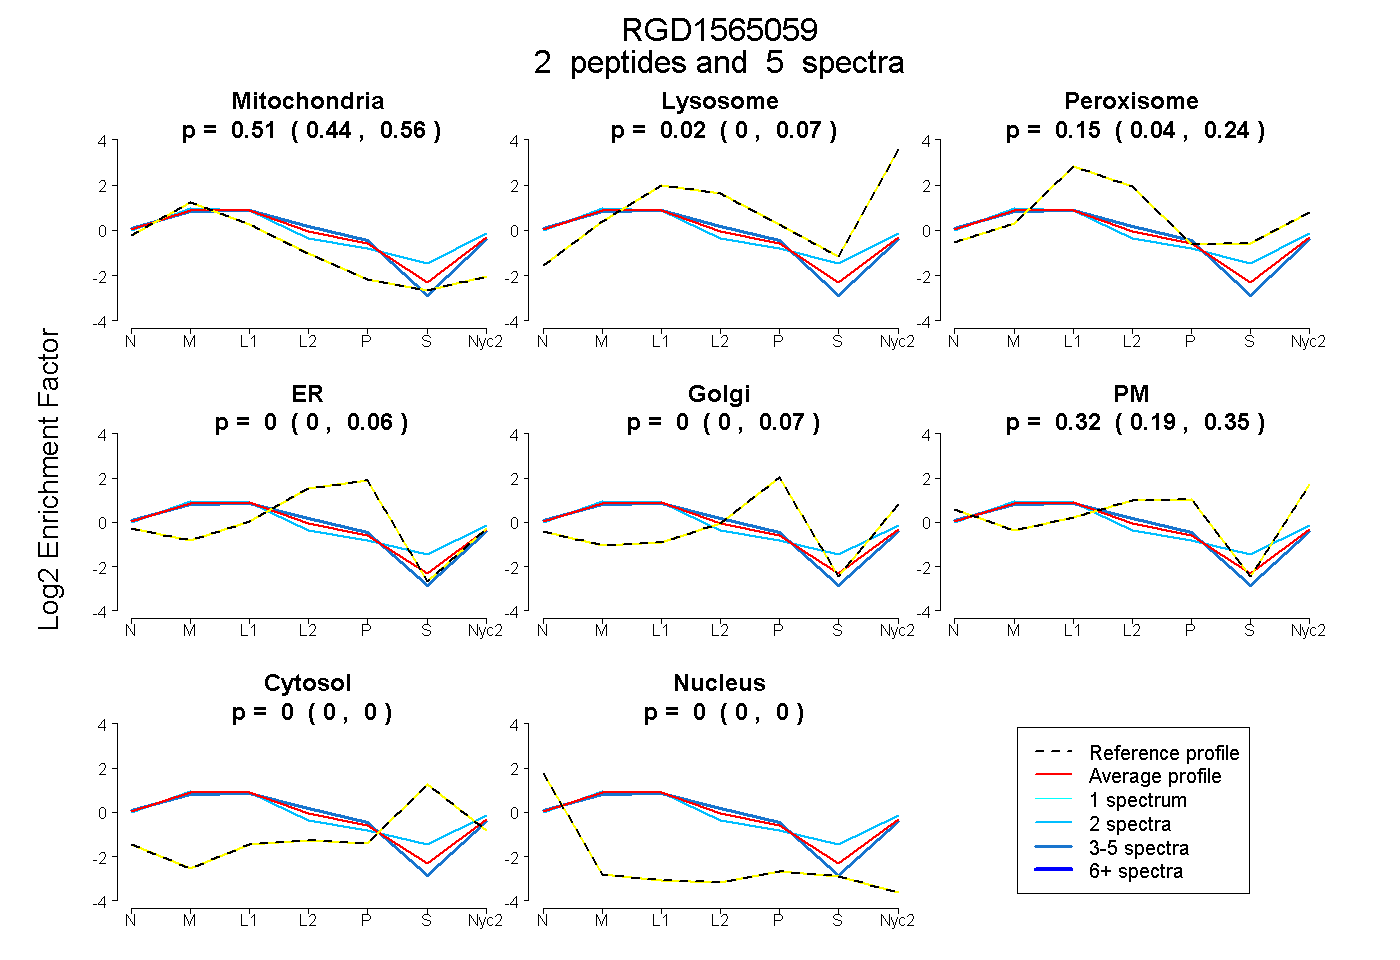
| Plot | Mito | Lyso | Perox | ER | Golgi | PM | Cytosol | Nucleus | |||||
| Expt A |
2 peptides |
5 spectra |
|
0.506 0.443 | 0.556 |
0.021 0.000 | 0.073 |
0.152 0.044 | 0.241 |
0.000 0.000 | 0.059 |
0.000 0.000 | 0.072 |
0.321 0.190 | 0.348 |
0.000 0.000 | 0.000 |
0.000 0.000 | 0.000 |
||
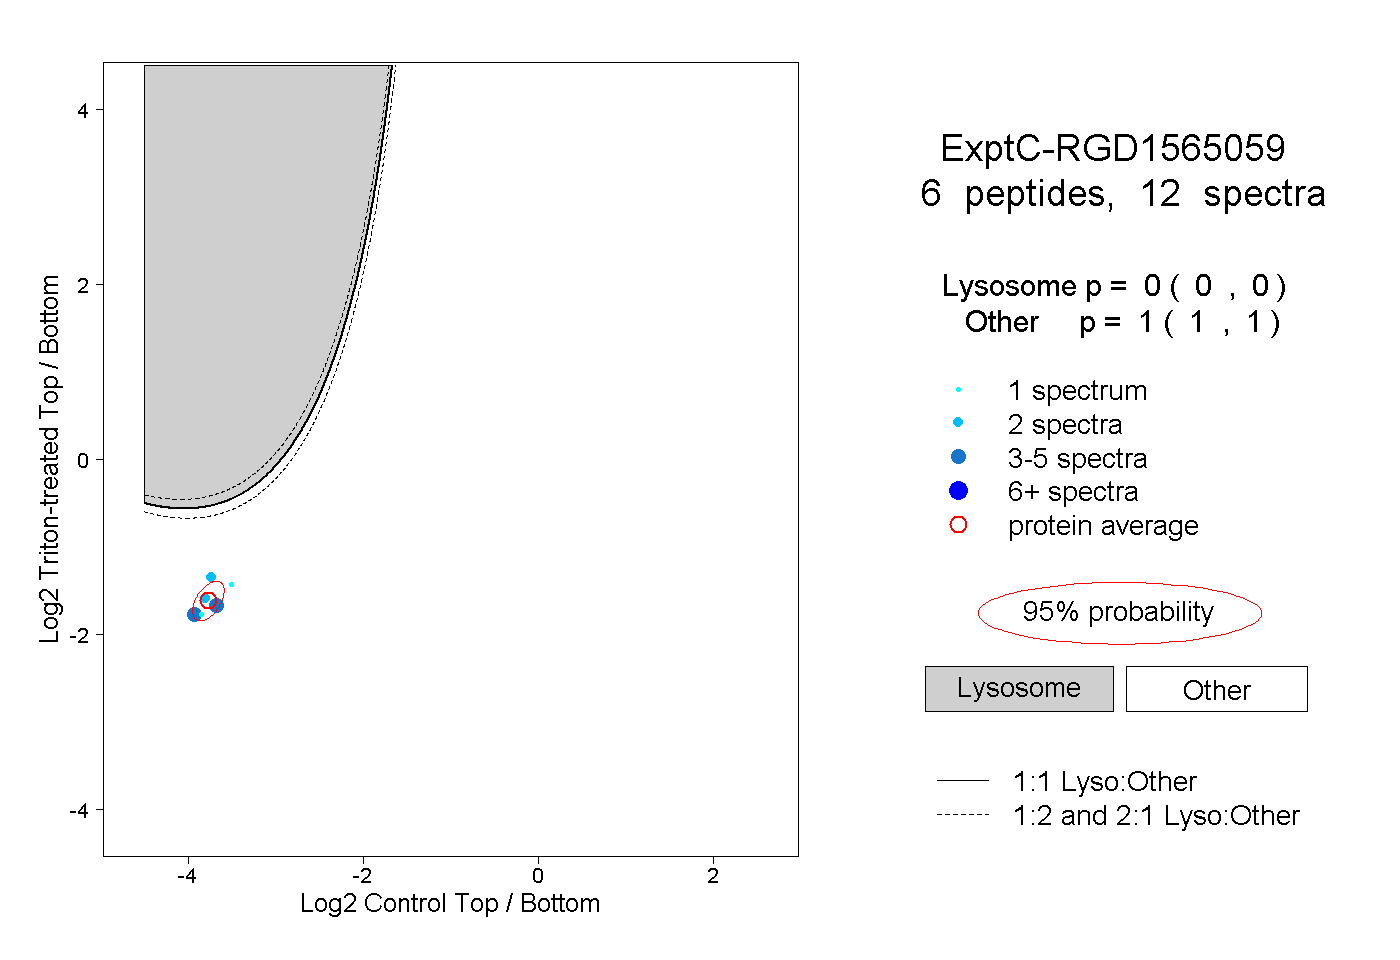
| Plot | Lyso | Other | |||||||||||
| Expt C |
6 peptides |
12 spectra |
|
0.000 0.000 | 0.000 |
1.000 1.000 | 1.000 |