 5
5peptides
spectra
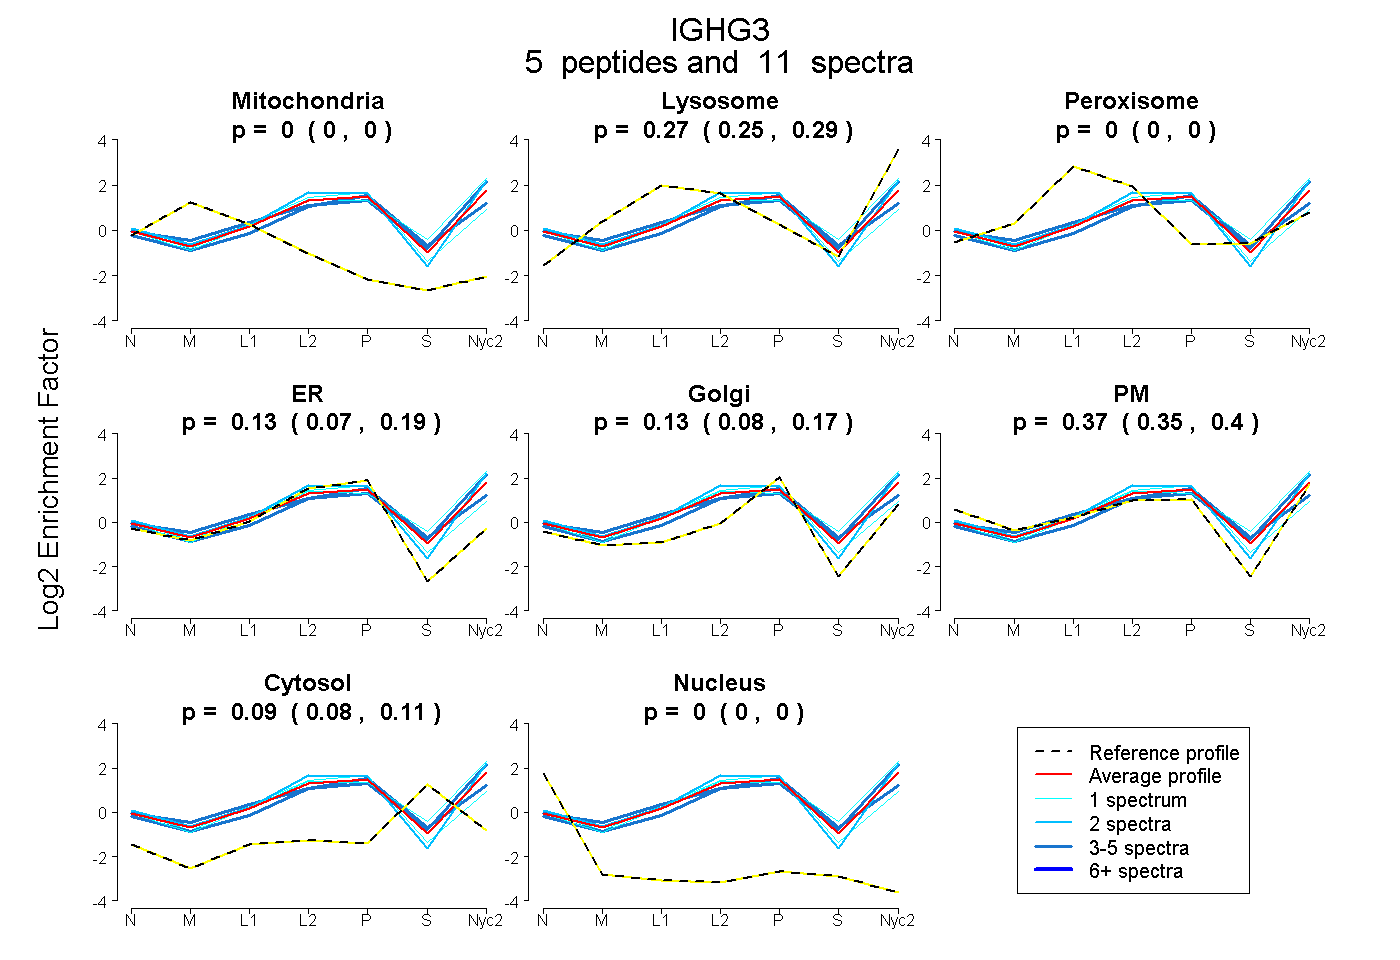
0.000 | 0.000
0.246 | 0.287
0.000 | 0.000
0.072 | 0.186
0.078 | 0.169
0.345 | 0.399
0.077 | 0.110
0.000 | 0.000
4peptides
spectra
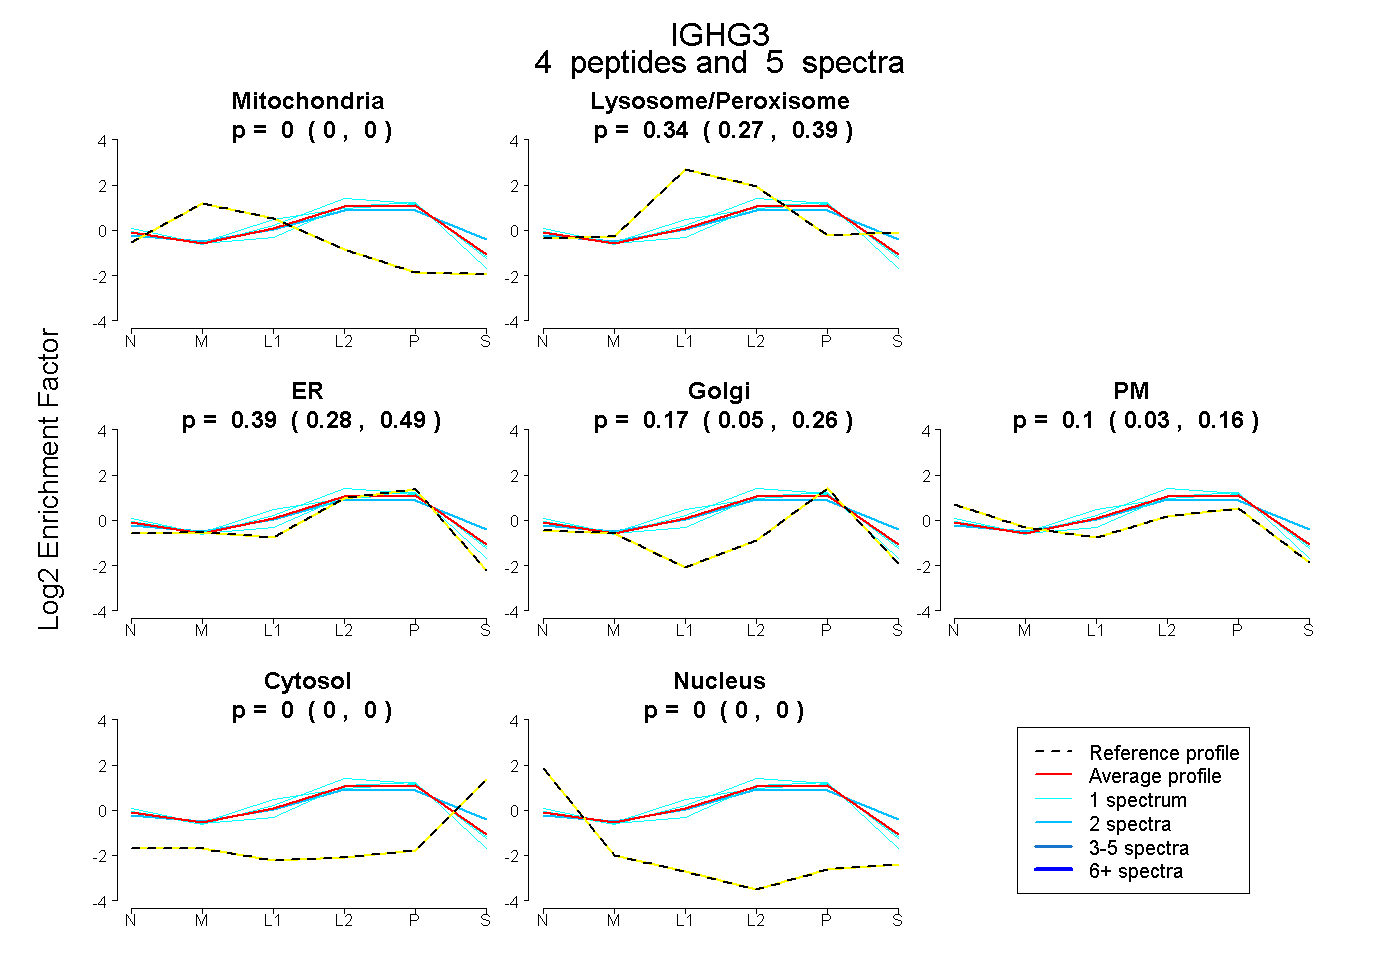
0.000 | 0.000
0.271 | 0.394
0.283 | 0.489
0.049 | 0.257
0.028 | 0.165
0.000 | 0.000
0.000 | 0.000
6peptides
spectra

0.000 | 0.001
0.999 | 1.000
1peptide
spectra
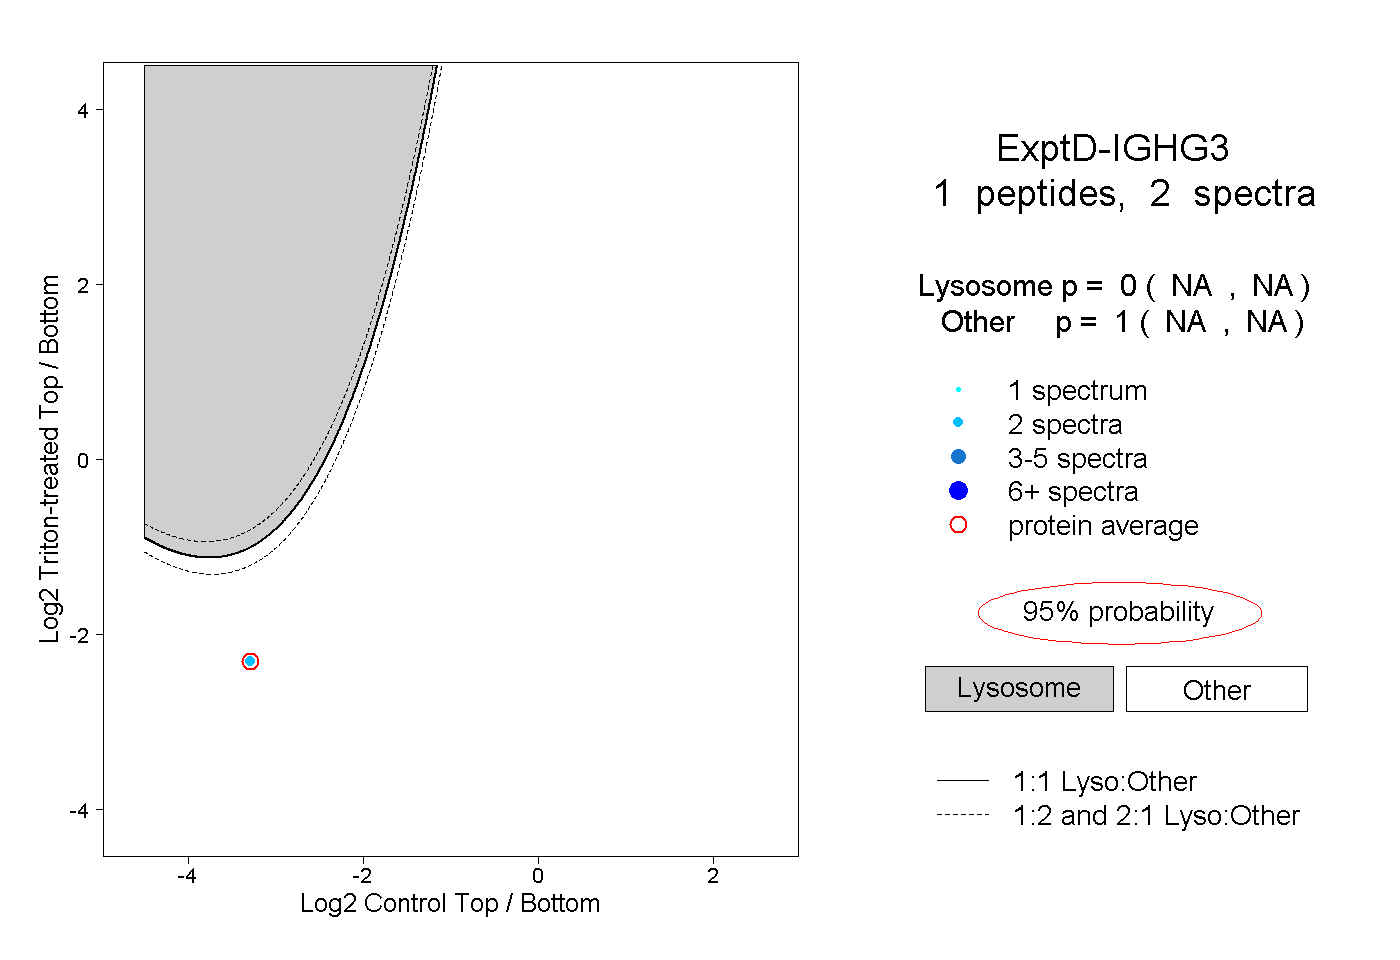
NA | NA
NA | NA