16
16peptides
spectra
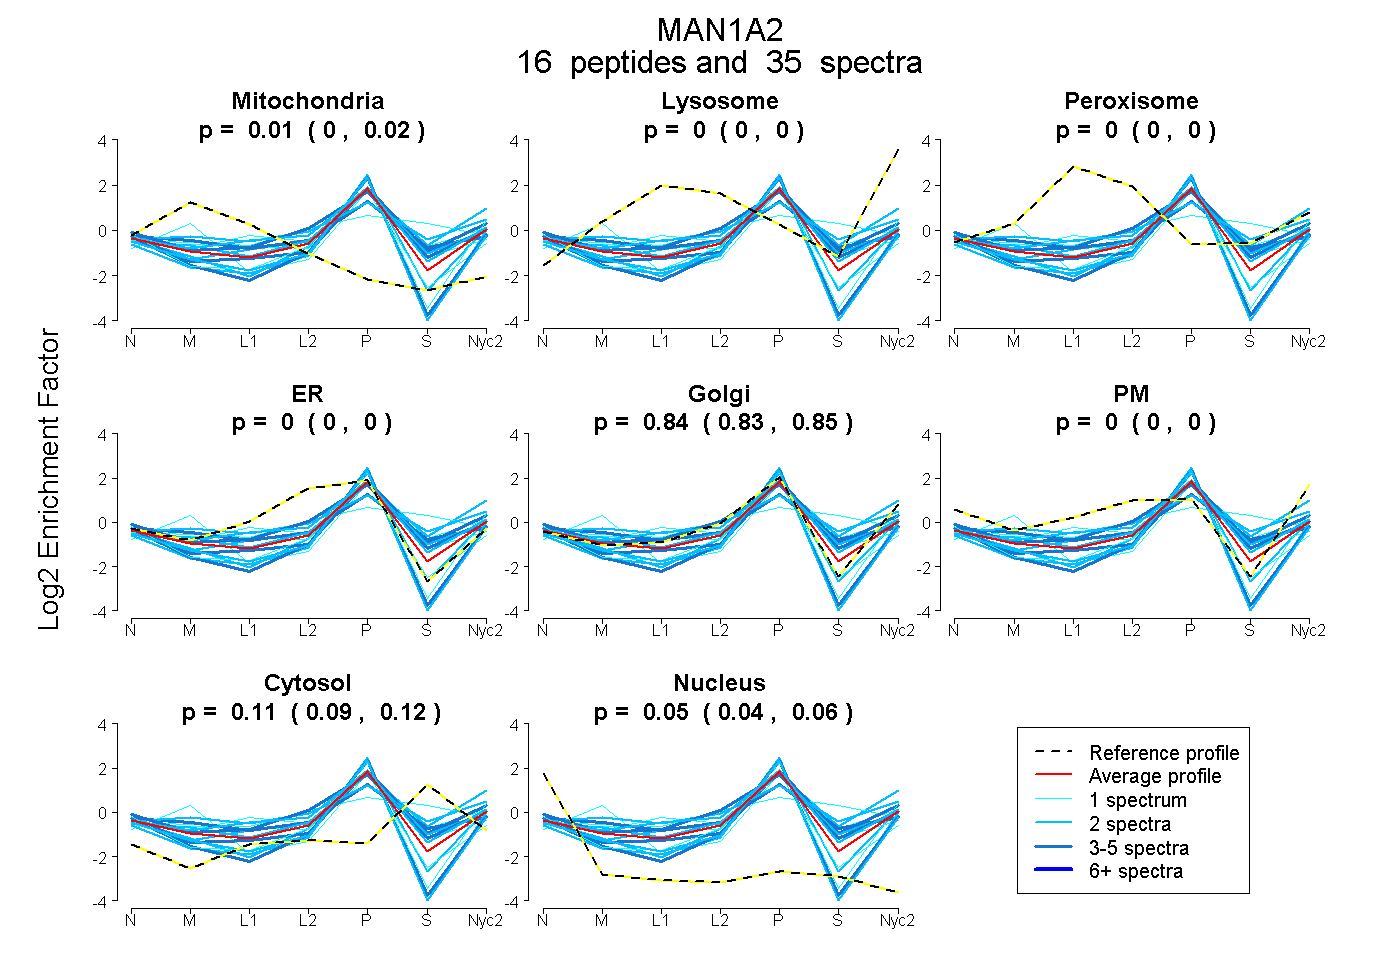
0.000 | 0.015
0.000 | 0.000
0.000 | 0.000
0.000 | 0.000
0.825 | 0.847
0.000 | 0.000
0.086 | 0.125
0.039 | 0.057
5peptides
spectra
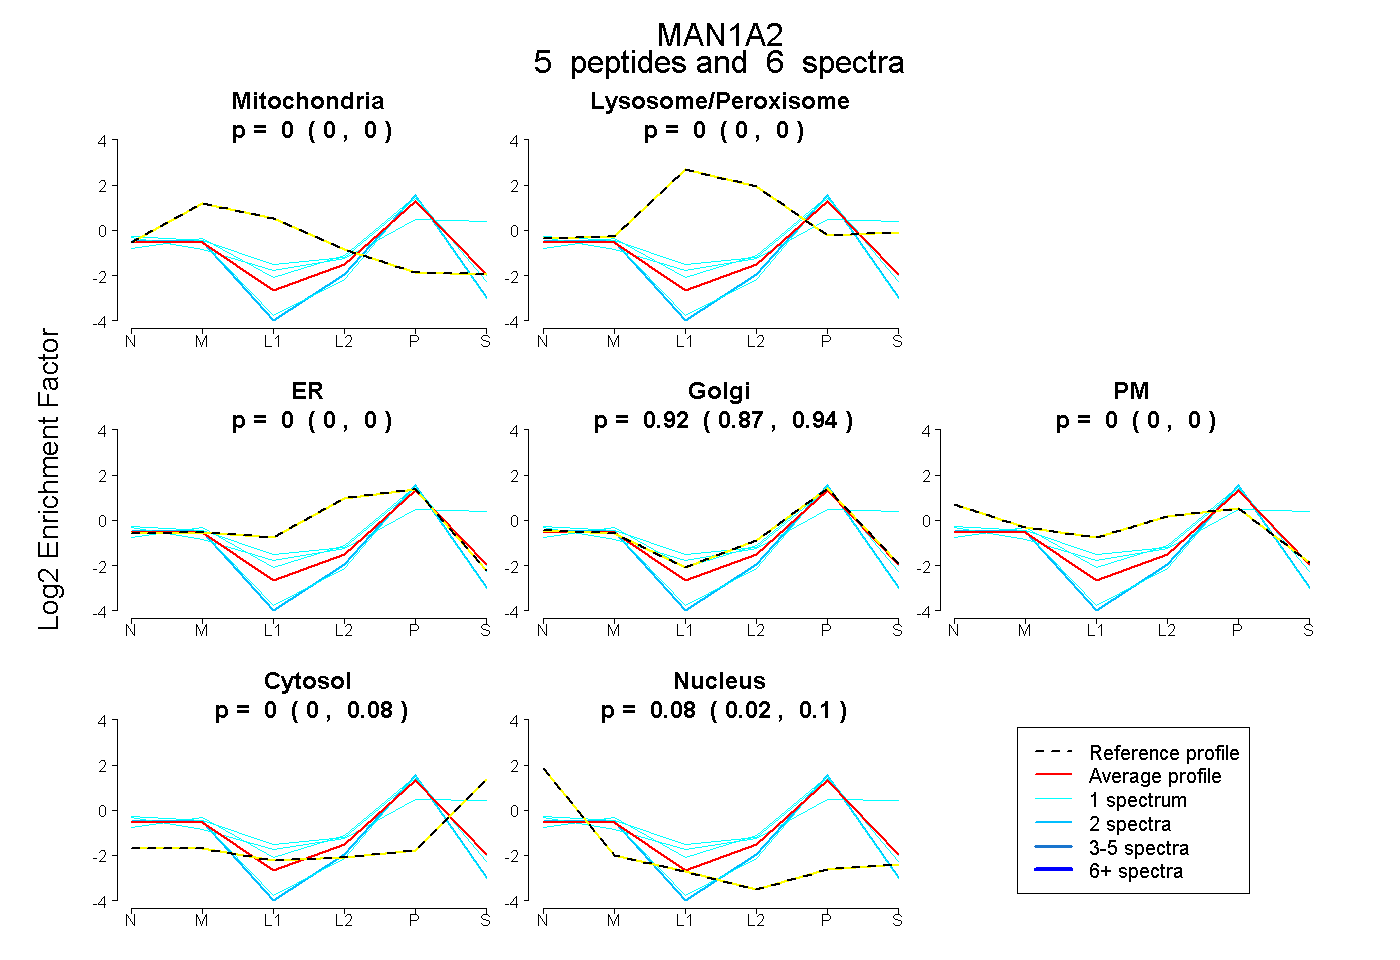
0.000 | 0.000
0.000 | 0.000
0.000 | 0.000
0.866 | 0.943
0.000 | 0.000
0.000 | 0.078
0.023 | 0.097