 16
16peptides
spectra
0.000 | 0.015
0.000 | 0.000
0.000 | 0.000
0.000 | 0.000
0.825 | 0.847
0.000 | 0.000
0.086 | 0.125
0.039 | 0.057
| Plot | Mito | Lyso | Perox | ER | Golgi | PM | Cytosol | Nucleus | |||||
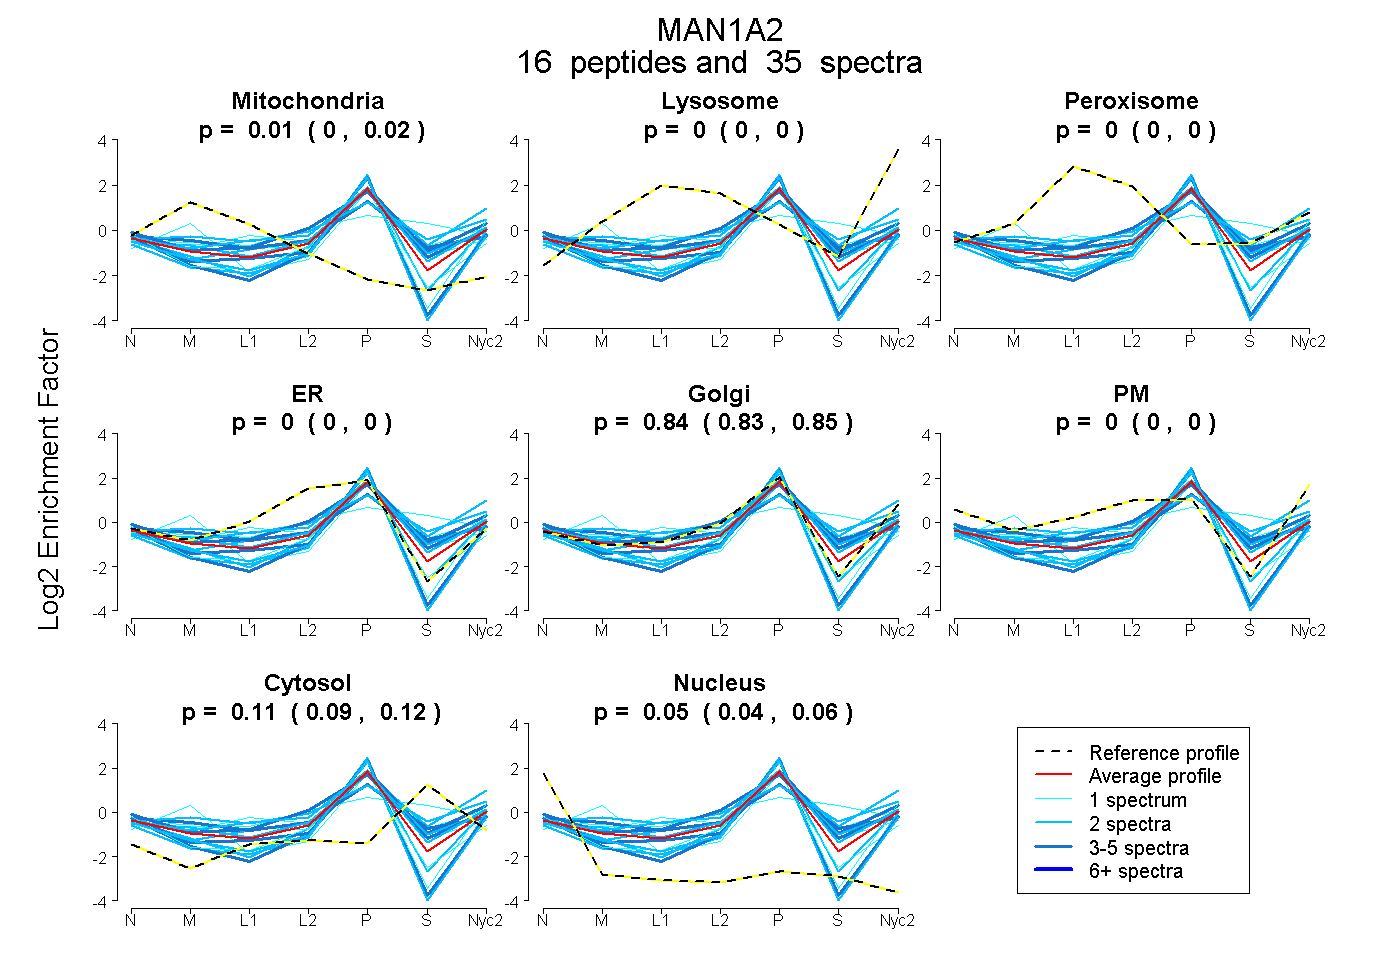
| Expt A |
16 peptides |
35 spectra |
|
0.006 0.000 | 0.015 |
0.000 0.000 | 0.000 |
0.000 0.000 | 0.000 |
0.000 0.000 | 0.000 |
0.837 0.825 | 0.847 |
0.000 0.000 | 0.000 |
0.107 0.086 | 0.125 |
0.049 0.039 | 0.057 |
| 2 spectra, VMHIR | 0.000 | 0.000 | 0.000 | 0.000 | 0.857 | 0.000 | 0.000 | 0.143 | ||
| 2 spectra, FDGAVEAVAVR | 0.000 | 0.000 | 0.000 | 0.000 | 0.889 | 0.000 | 0.000 | 0.111 | ||
| 1 spectrum, GGLVFIGEWK | 0.076 | 0.000 | 0.000 | 0.020 | 0.715 | 0.000 | 0.189 | 0.000 | ||
| 2 spectra, VSGGFSGVK | 0.000 | 0.000 | 0.058 | 0.108 | 0.692 | 0.000 | 0.142 | 0.000 | ||
| 1 spectrum, IPPLNLGPPSFPHHR | 0.000 | 0.000 | 0.191 | 0.116 | 0.272 | 0.000 | 0.421 | 0.000 | ||
| 1 spectrum, VLPPVPVPQR | 0.000 | 0.000 | 0.000 | 0.000 | 0.900 | 0.000 | 0.000 | 0.100 | ||
| 4 spectra, VAQAMK | 0.000 | 0.000 | 0.010 | 0.245 | 0.533 | 0.015 | 0.197 | 0.000 | ||
| 5 spectra, VGVSGGDPEDAEIR | 0.000 | 0.000 | 0.000 | 0.000 | 0.836 | 0.000 | 0.000 | 0.164 | ||
| 2 spectra, MYDDAVEAIEK | 0.000 | 0.000 | 0.000 | 0.000 | 0.867 | 0.000 | 0.000 | 0.133 | ||
| 4 spectra, MERPNGLYPNYLNPR | 0.093 | 0.000 | 0.041 | 0.046 | 0.573 | 0.000 | 0.247 | 0.000 | ||
| 2 spectra, AVQLAEK | 0.000 | 0.068 | 0.000 | 0.000 | 0.695 | 0.000 | 0.237 | 0.000 | ||
| 1 spectrum, FDLGLEDVLIPHVDAGK | 0.180 | 0.000 | 0.000 | 0.000 | 0.742 | 0.000 | 0.000 | 0.078 | ||
| 1 spectrum, AGHYLELGAEIAR | 0.000 | 0.000 | 0.126 | 0.000 | 0.662 | 0.000 | 0.212 | 0.000 | ||
| 2 spectra, QWGWEAALAIEK | 0.020 | 0.000 | 0.000 | 0.011 | 0.743 | 0.000 | 0.227 | 0.000 | ||
| 3 spectra, LGPESFK | 0.000 | 0.000 | 0.000 | 0.000 | 0.744 | 0.000 | 0.256 | 0.000 | ||
| 2 spectra, MGHLACFAGGMFALGADGSR | 0.000 | 0.029 | 0.183 | 0.000 | 0.559 | 0.000 | 0.228 | 0.000 |
| Plot | Mito | Lyso or Perox | ER | Golgi | PM | Cytosol | Nucleus | ||||||
| Expt B |
5 peptides |
6 spectra |
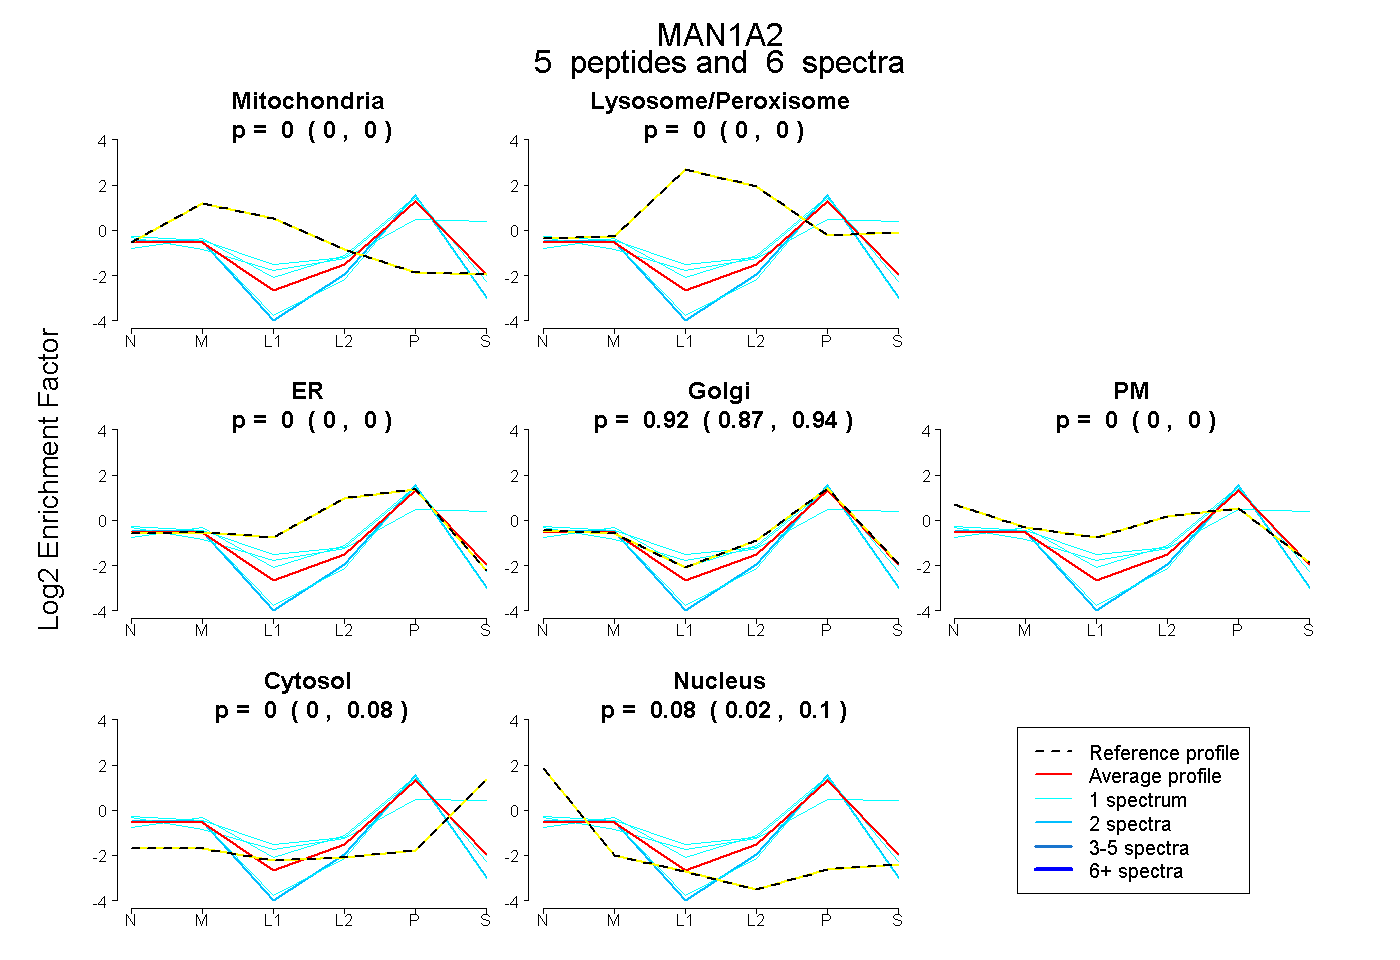 |
0.000 0.000 | 0.000 |
0.000 0.000 | 0.000 |
0.000 0.000 | 0.000 |
0.925 0.866 | 0.943 |
0.000 0.000 | 0.000 |
0.000 0.000 | 0.078 |
0.075 0.023 | 0.097 |
|||
| Plot | Lyso | Other | |||||||||||
| Expt C |
10 peptides |
27 spectra |
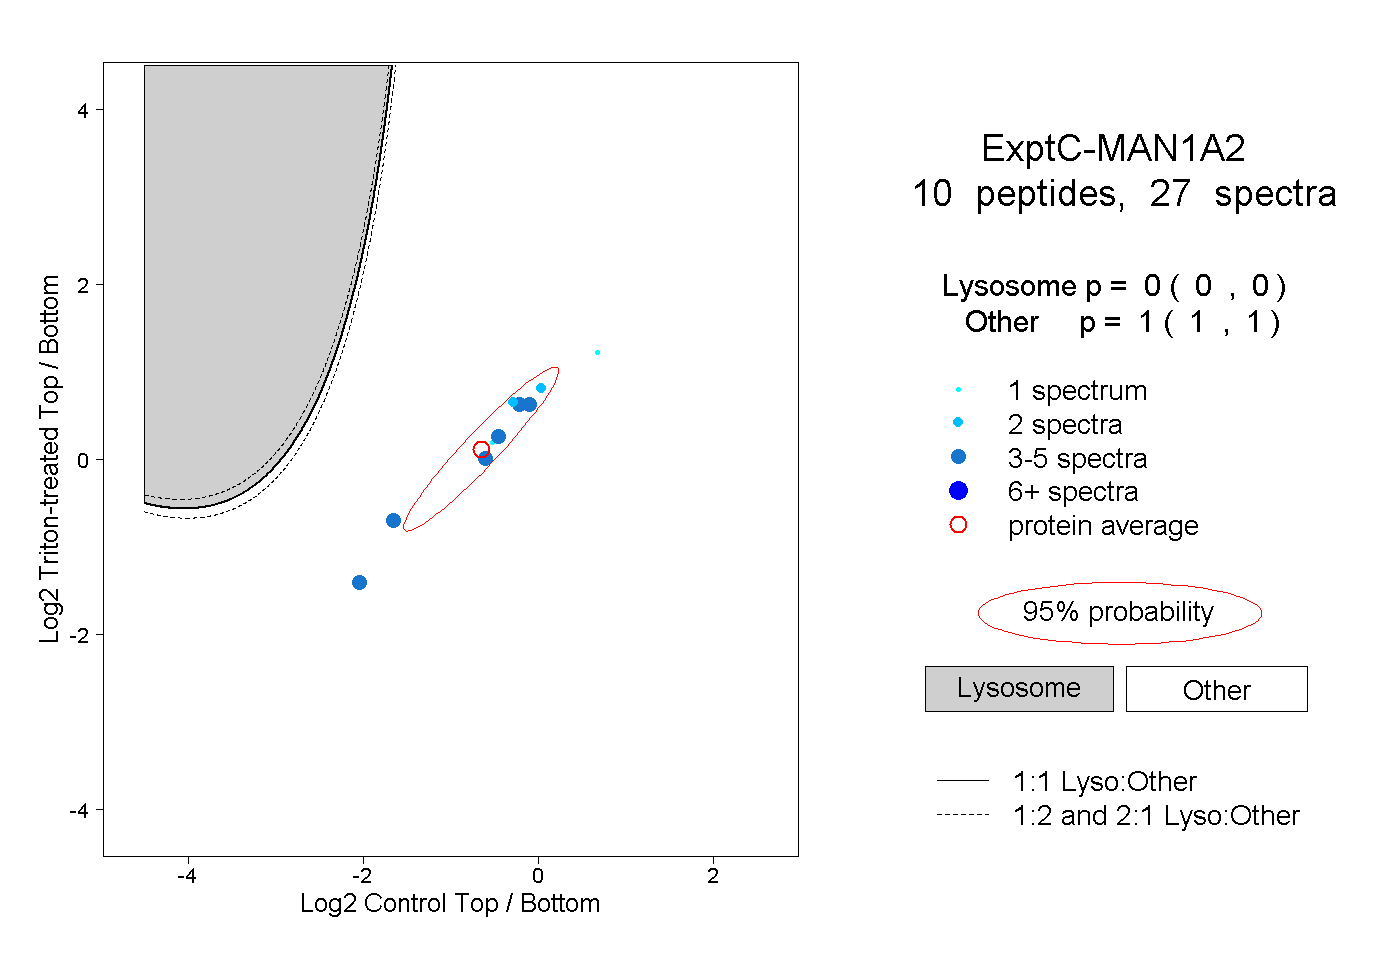 |
0.000 0.000 | 0.000 |
1.000 1.000 | 1.000 |