| 1 spectrum, YDATMVEINPMVEDADGK |
0.667 |
|
0.155 |
|
0.000 |
0.178 |
0.000 |
0.000 |
0.000 |
|
| 6 spectra, ILACDDLDEAAK |
0.917 |
|
0.054 |
|
0.000 |
0.000 |
0.028 |
0.000 |
0.000 |
|
| 4 spectra, LSEIVTLAK |
0.980 |
|
0.000 |
|
0.000 |
0.000 |
0.000 |
0.000 |
0.020 |
|
| 3 spectra, EYYFAITMER |
0.984 |
|
0.000 |
|
0.000 |
0.000 |
0.000 |
0.000 |
0.016 |
|
| 12 spectra, AQVLAGGR |
0.978 |
|
0.000 |
|
0.000 |
0.000 |
0.000 |
0.000 |
0.022 |
|
| 2 spectra, AVSSQMIGQK |
0.858 |
|
0.000 |
|
0.142 |
0.000 |
0.000 |
0.000 |
0.000 |
|
| 2 spectra, ALIADSGLK |
0.991 |
|
0.000 |
|
0.000 |
0.000 |
0.000 |
0.000 |
0.009 |
|
| 4 spectra, IVFSPEEAK |
1.000 |
|
0.000 |
|
0.000 |
0.000 |
0.000 |
0.000 |
0.000 |
|
| 3 spectra, EQAVTLAK |
0.932 |
|
0.068 |
|
0.000 |
0.000 |
0.000 |
0.000 |
0.000 |
|
| 2 spectra, SSDEAYAIAK |
0.921 |
|
0.000 |
|
0.000 |
0.000 |
0.000 |
0.038 |
0.041 |
|
| 1 spectrum, LITSDK |
0.973 |
|
0.027 |
|
0.000 |
0.000 |
0.000 |
0.000 |
0.000 |
|
| 3 spectra, EPVDIIEGVK |
1.000 |
|
0.000 |
|
0.000 |
0.000 |
0.000 |
0.000 |
0.000 |
|
| 8 spectra, INFDSNSAYR |
0.957 |
|
0.000 |
|
0.000 |
0.000 |
0.000 |
0.000 |
0.043 |
|
| 5 spectra, EAHVDVK |
1.000 |
|
0.000 |
|
0.000 |
0.000 |
0.000 |
0.000 |
0.000 |
|
| 1 spectrum, CDIIAQGIVMAVK |
1.000 |
|
0.000 |
|
0.000 |
0.000 |
0.000 |
0.000 |
0.000 |
|
| 8 spectra, LYNLFLK |
0.826 |
|
0.137 |
|
0.000 |
0.037 |
0.000 |
0.000 |
0.000 |
|
| 5 spectra, ICNQVLVCER |
0.990 |
|
0.000 |
|
0.000 |
0.000 |
0.000 |
0.000 |
0.010 |
|
| 3 spectra, IFALQDWSQEDER |
1.000 |
|
0.000 |
|
0.000 |
0.000 |
0.000 |
0.000 |
0.000 |
|
| 13 spectra, IPVVVR |
0.991 |
|
0.000 |
|
0.000 |
0.000 |
0.000 |
0.000 |
0.009 |
|
| 2 spectra, GTFTSGLK |
0.718 |
|
0.158 |
|
0.000 |
0.044 |
0.000 |
0.080 |
0.000 |
|
| 1 spectrum, LHGGTPANFLDVGGGATVHQVTEAFK |
0.401 |
|
0.359 |
|
0.000 |
0.000 |
0.000 |
0.241 |
0.000 |
|
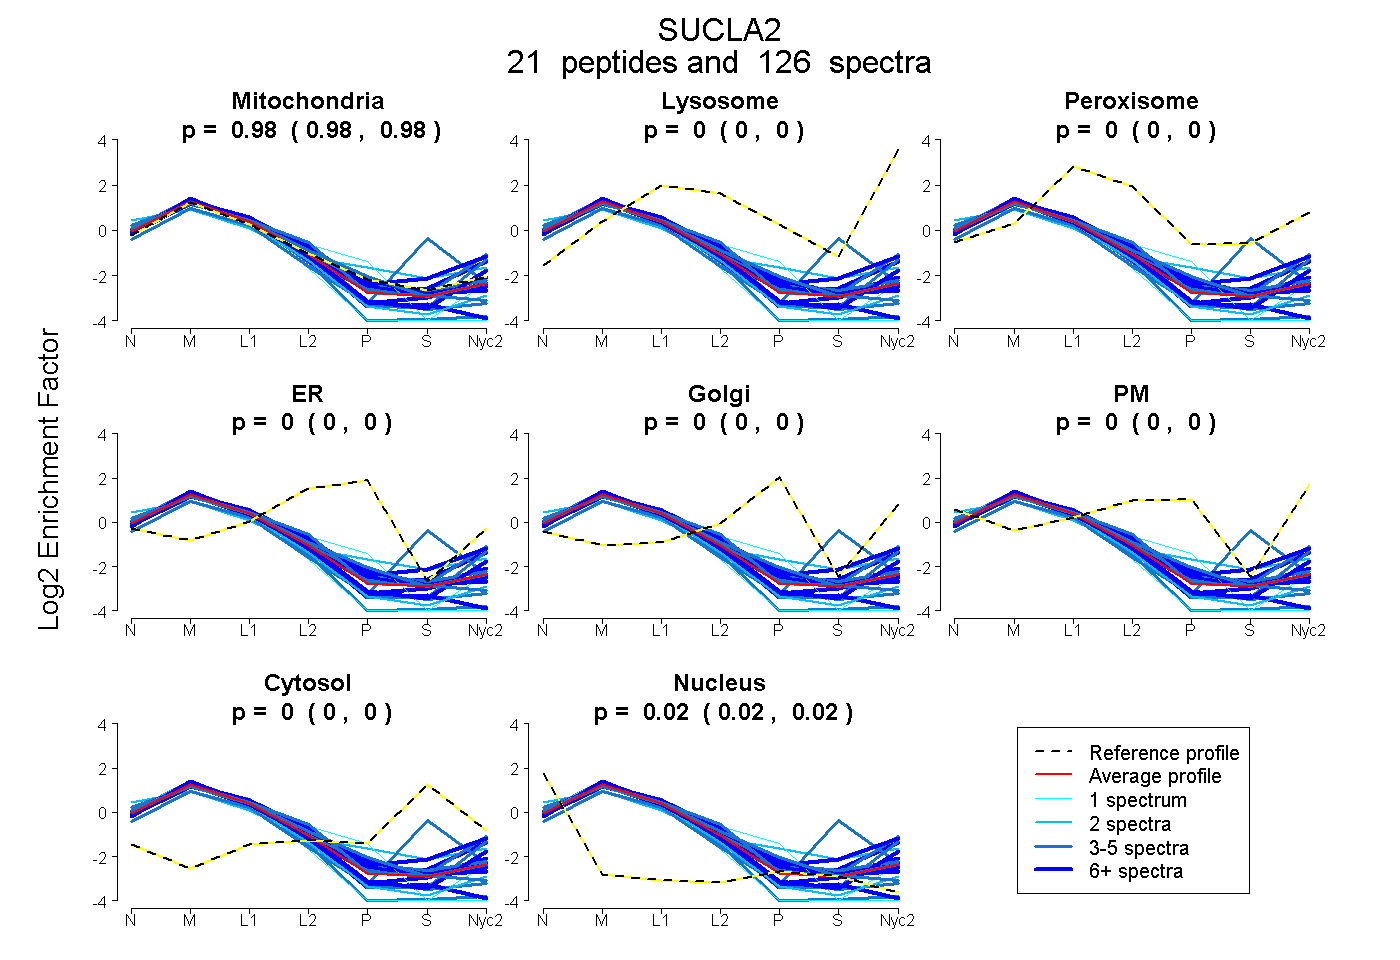
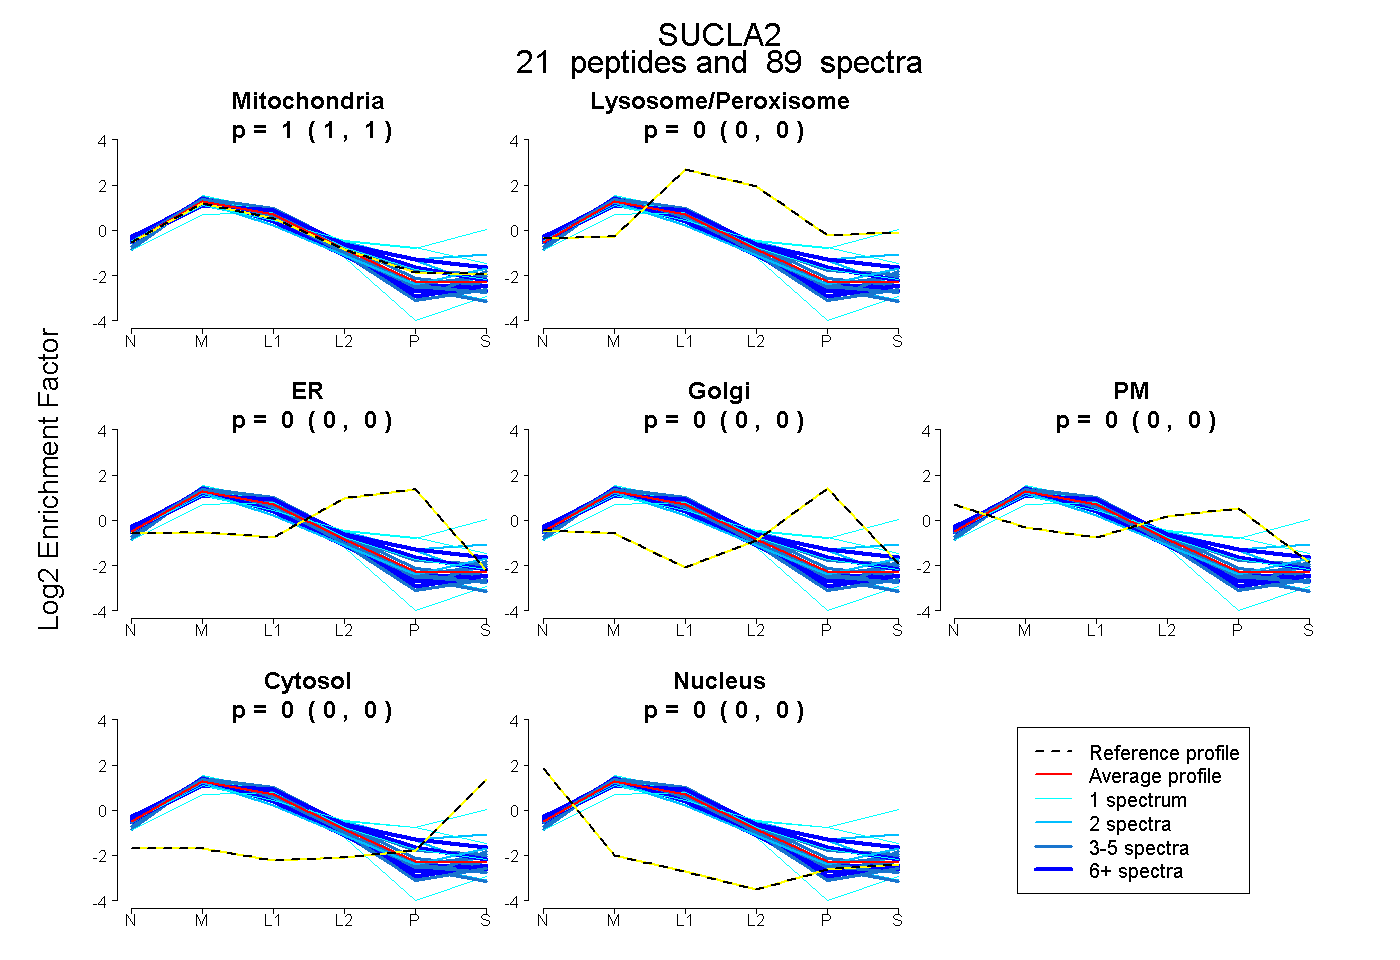
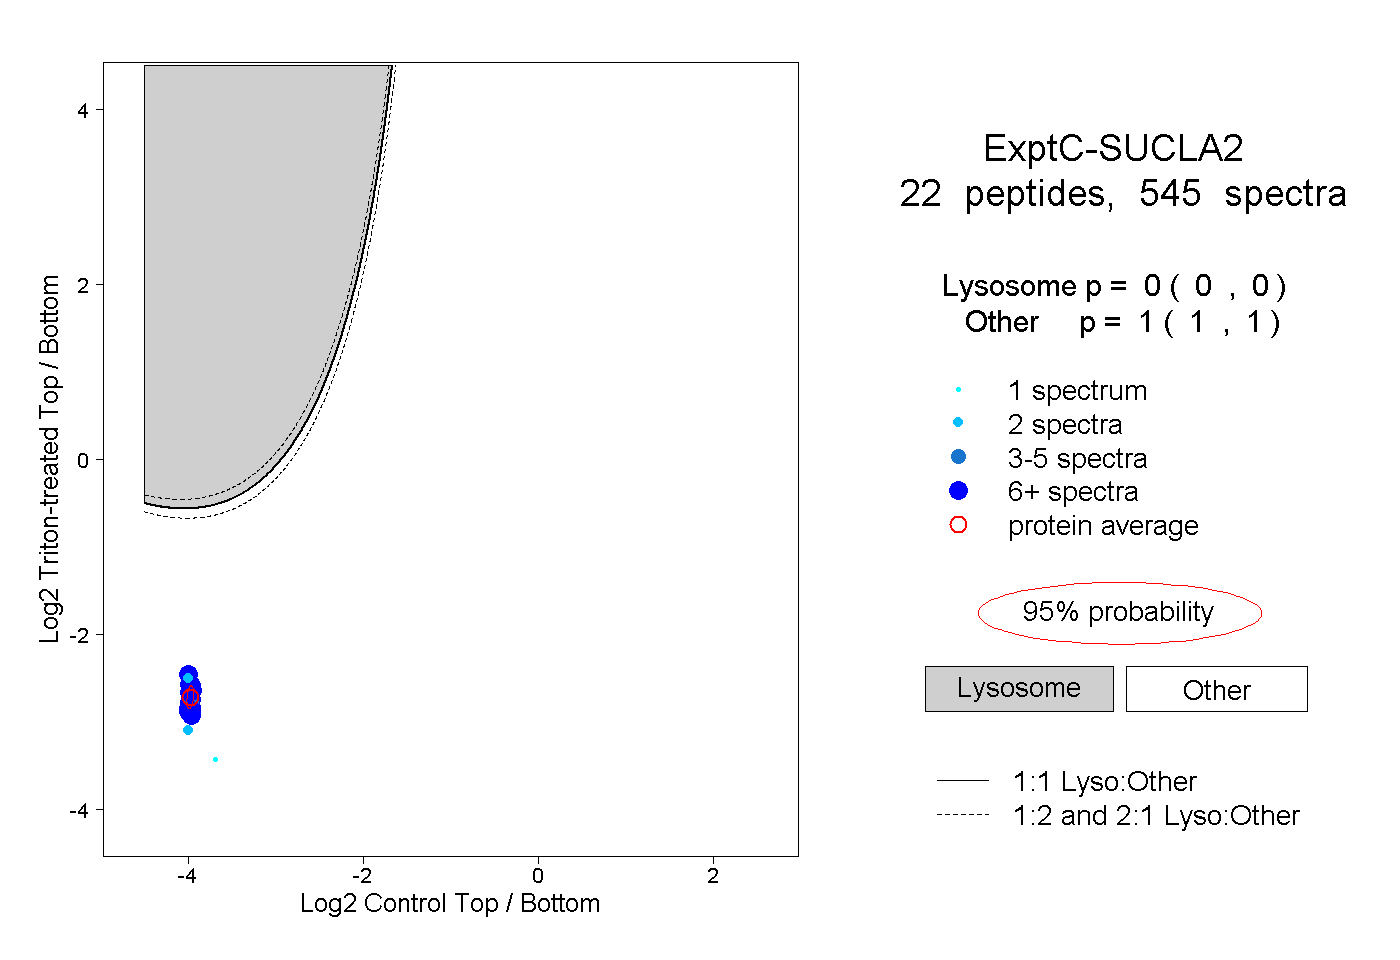
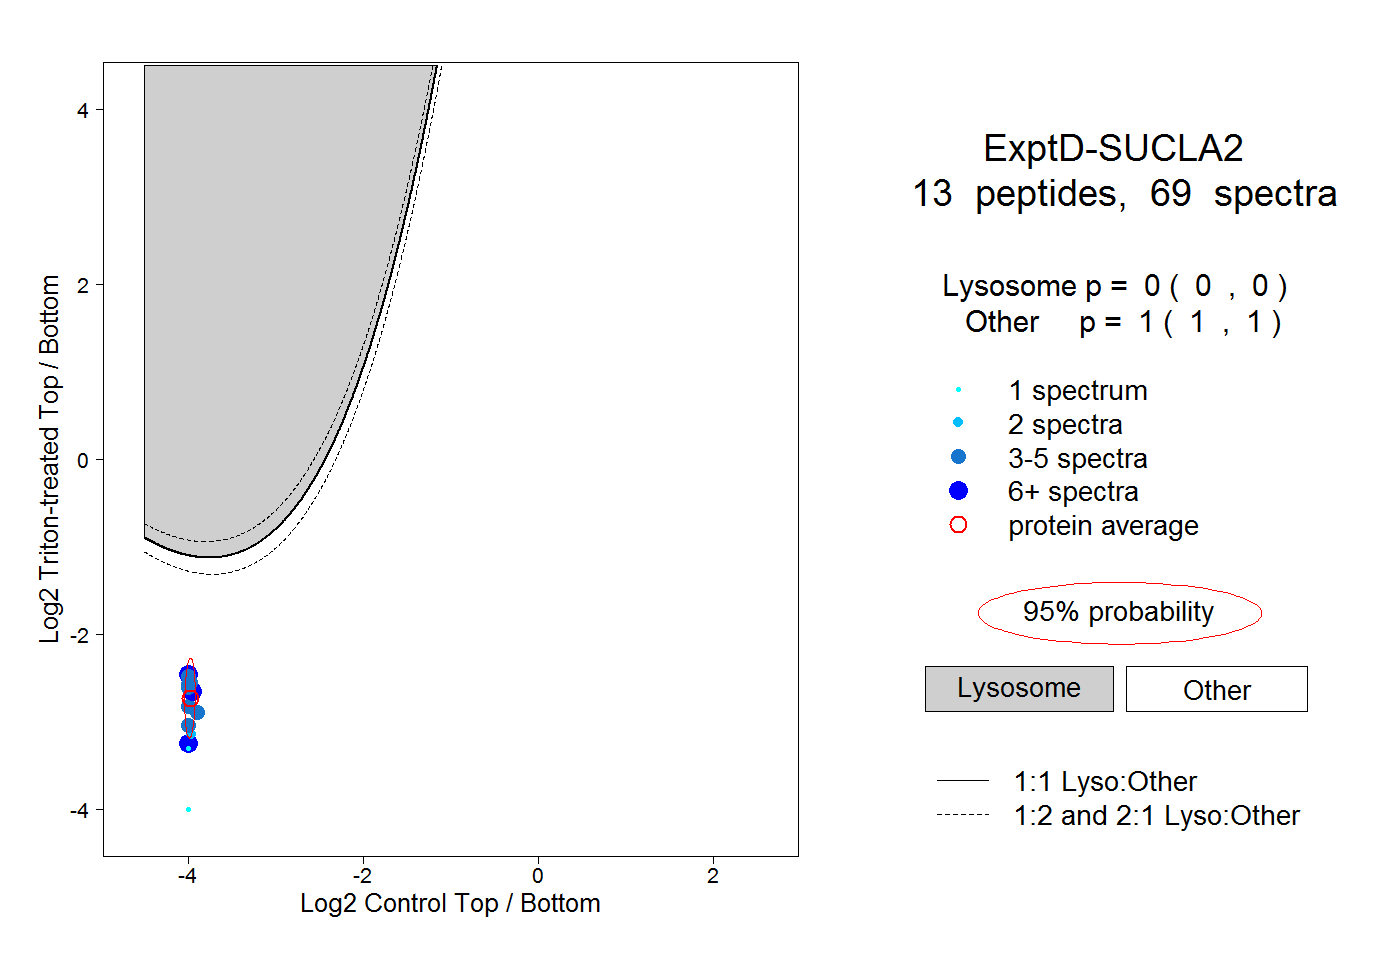
 21
21