 21
21peptides
spectra
0.977 | 0.980
0.000 | 0.000
0.000 | 0.000
0.000 | 0.000
0.000 | 0.000
0.000 | 0.000
0.000 | 0.000
0.020 | 0.023
| Plot | Mito | Lyso | Perox | ER | Golgi | PM | Cytosol | Nucleus | |||||
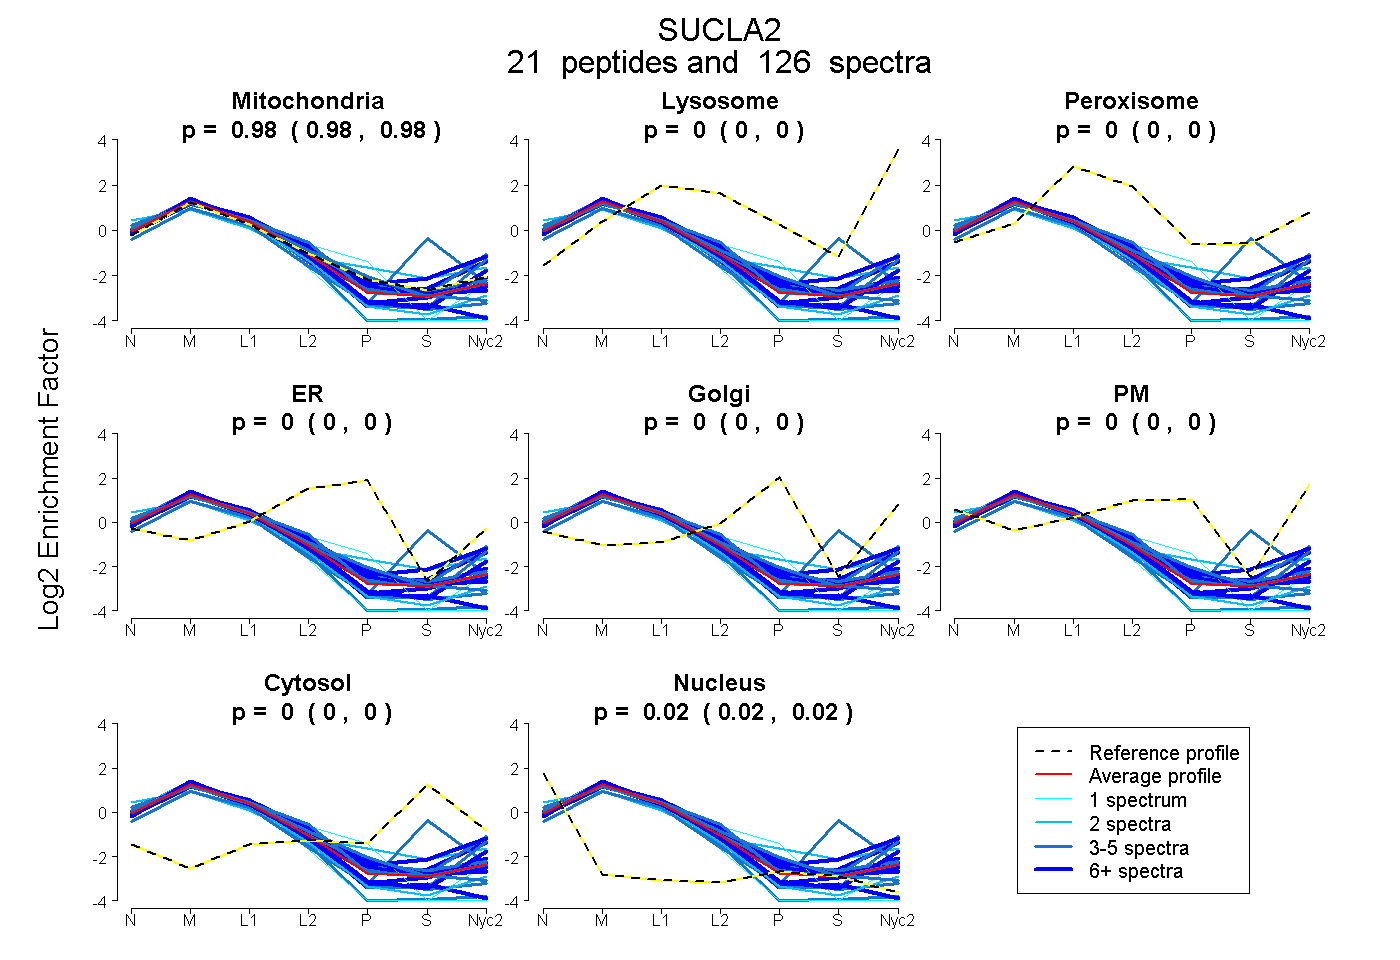
| Expt A |
21 peptides |
126 spectra |
|
0.978 0.977 | 0.980 |
0.000 0.000 | 0.000 |
0.000 0.000 | 0.000 |
0.000 0.000 | 0.000 |
0.000 0.000 | 0.000 |
0.000 0.000 | 0.000 |
0.000 0.000 | 0.000 |
0.022 0.020 | 0.023 |
| 5 spectra, YDATMVEINPMVEDADGK | 0.973 | 0.000 | 0.000 | 0.000 | 0.000 | 0.000 | 0.000 | 0.027 | ||
| 16 spectra, ILACDDLDEAAK | 0.976 | 0.000 | 0.000 | 0.000 | 0.000 | 0.000 | 0.000 | 0.024 | ||
| 2 spectra, LSEIVTLAK | 0.933 | 0.000 | 0.000 | 0.000 | 0.000 | 0.000 | 0.000 | 0.067 | ||
| 4 spectra, EYYFAITMER | 0.900 | 0.083 | 0.000 | 0.000 | 0.000 | 0.000 | 0.000 | 0.017 | ||
| 19 spectra, AQVLAGGR | 0.935 | 0.050 | 0.000 | 0.000 | 0.000 | 0.000 | 0.000 | 0.015 | ||
| 5 spectra, VLCMDAK | 0.969 | 0.000 | 0.000 | 0.014 | 0.000 | 0.000 | 0.000 | 0.018 | ||
| 5 spectra, AVSSQMIGQK | 0.985 | 0.000 | 0.000 | 0.000 | 0.000 | 0.000 | 0.000 | 0.015 | ||
| 2 spectra, ALIADSGLK | 0.766 | 0.000 | 0.030 | 0.000 | 0.000 | 0.106 | 0.019 | 0.079 | ||
| 4 spectra, IVFSPEEAK | 0.988 | 0.000 | 0.004 | 0.000 | 0.000 | 0.000 | 0.000 | 0.007 | ||
| 1 spectrum, EQAVTLAK | 0.926 | 0.000 | 0.000 | 0.000 | 0.000 | 0.000 | 0.000 | 0.074 | ||
| 6 spectra, SSDEAYAIAK | 1.000 | 0.000 | 0.000 | 0.000 | 0.000 | 0.000 | 0.000 | 0.000 | ||
| 5 spectra, EPVDIIEGVK | 0.889 | 0.000 | 0.000 | 0.000 | 0.000 | 0.000 | 0.000 | 0.111 | ||
| 8 spectra, INFDSNSAYR | 0.982 | 0.000 | 0.000 | 0.000 | 0.000 | 0.000 | 0.000 | 0.018 | ||
| 5 spectra, CDIIAQGIVMAVK | 0.958 | 0.000 | 0.000 | 0.000 | 0.000 | 0.000 | 0.000 | 0.042 | ||
| 10 spectra, LYNLFLK | 1.000 | 0.000 | 0.000 | 0.000 | 0.000 | 0.000 | 0.000 | 0.000 | ||
| 6 spectra, ICNQVLVCER | 0.913 | 0.000 | 0.000 | 0.000 | 0.000 | 0.000 | 0.000 | 0.087 | ||
| 4 spectra, IFALQDWSQEDER | 1.000 | 0.000 | 0.000 | 0.000 | 0.000 | 0.000 | 0.000 | 0.000 | ||
| 6 spectra, IPVVVR | 0.967 | 0.000 | 0.000 | 0.000 | 0.000 | 0.000 | 0.000 | 0.033 | ||
| 9 spectra, MGFPSNIVDSAAENMIK | 0.842 | 0.064 | 0.072 | 0.000 | 0.000 | 0.000 | 0.023 | 0.000 | ||
| 3 spectra, GTFTSGLK | 0.740 | 0.000 | 0.000 | 0.000 | 0.000 | 0.000 | 0.260 | 0.000 | ||
| 1 spectrum, LHGGTPANFLDVGGGATVHQVTEAFK | 0.942 | 0.000 | 0.000 | 0.019 | 0.000 | 0.000 | 0.000 | 0.039 |
| Plot | Mito | Lyso or Perox | ER | Golgi | PM | Cytosol | Nucleus | ||||||
| Expt B |
21 peptides |
89 spectra |
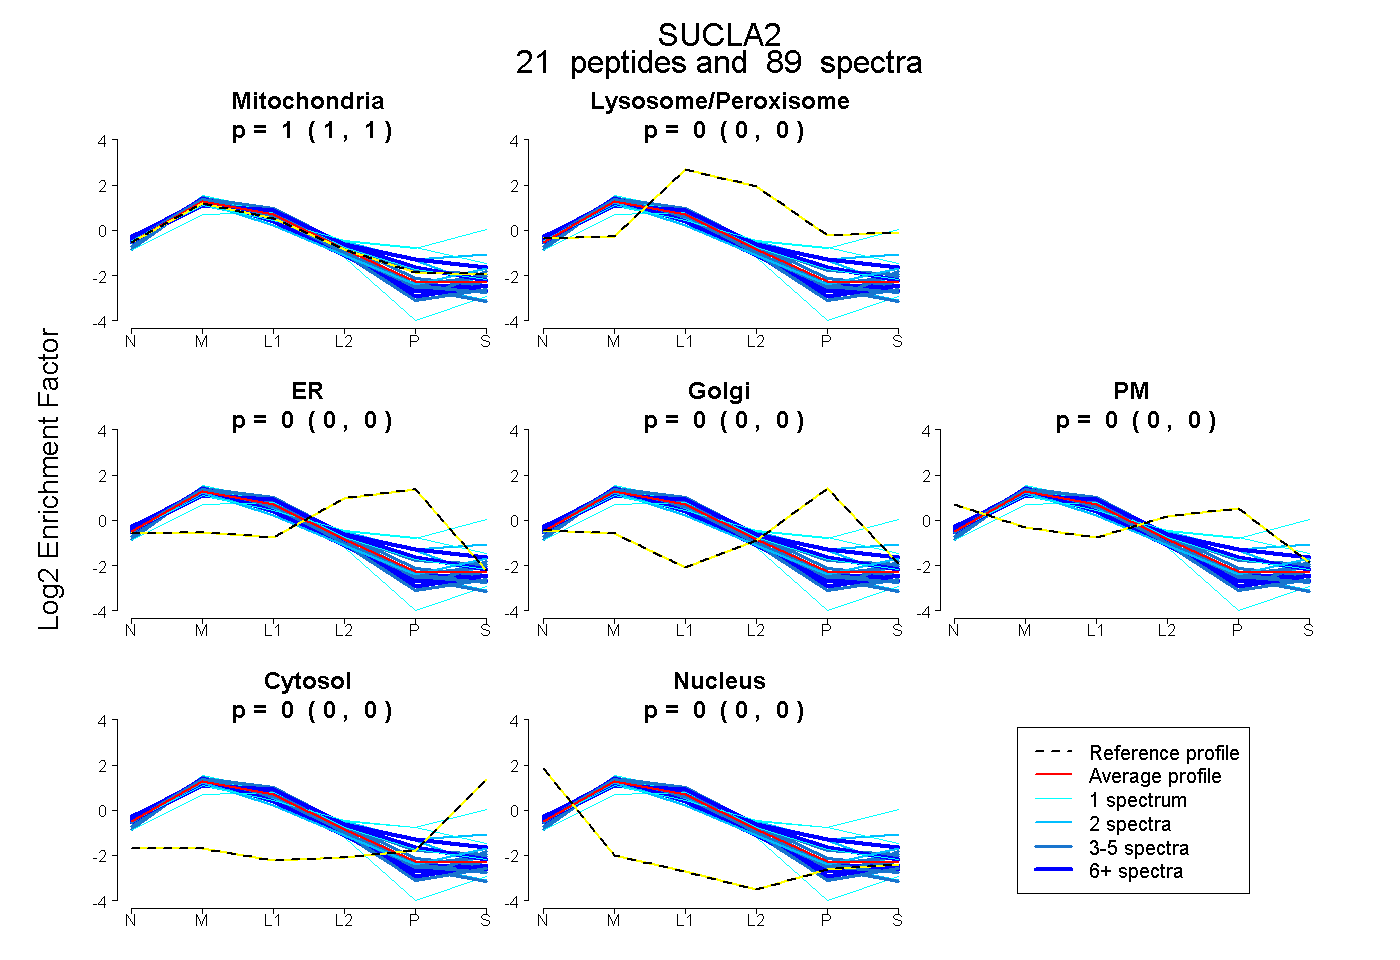 |
1.000 1.000 | 1.000 |
0.000 0.000 | 0.000 |
0.000 0.000 | 0.000 |
0.000 0.000 | 0.000 |
0.000 0.000 | 0.000 |
0.000 0.000 | 0.000 |
0.000 0.000 | 0.000 |
|||
| Plot | Lyso | Other | |||||||||||
| Expt C |
22 peptides |
545 spectra |
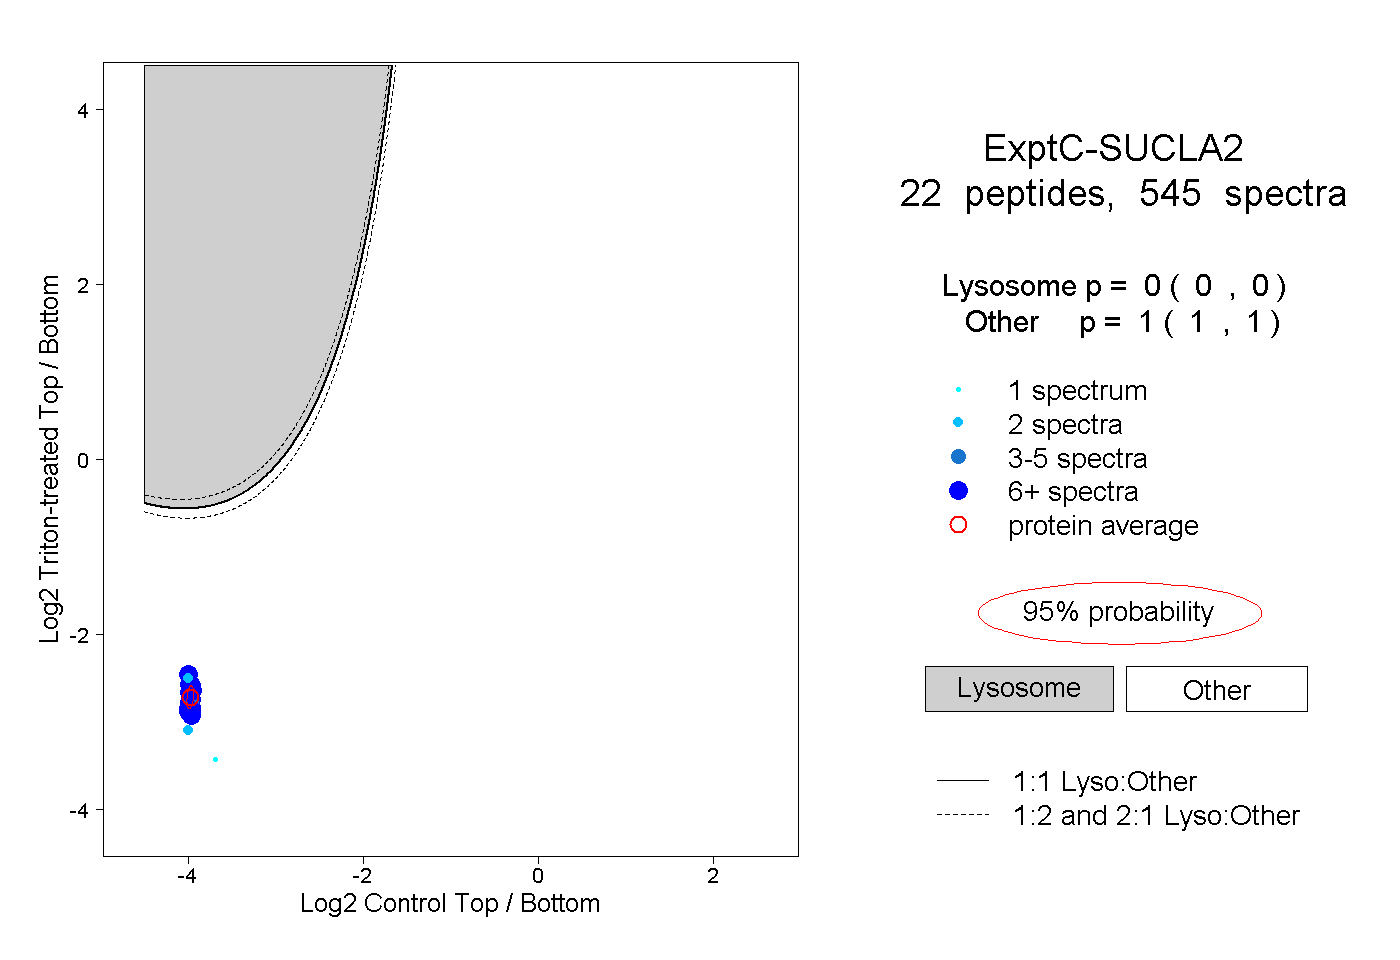 |
0.000 0.000 | 0.000 |
1.000 1.000 | 1.000 |
||||||||
| Plot | Lyso | Other | |||||||||||
| Expt D |
13 peptides |
69 spectra |
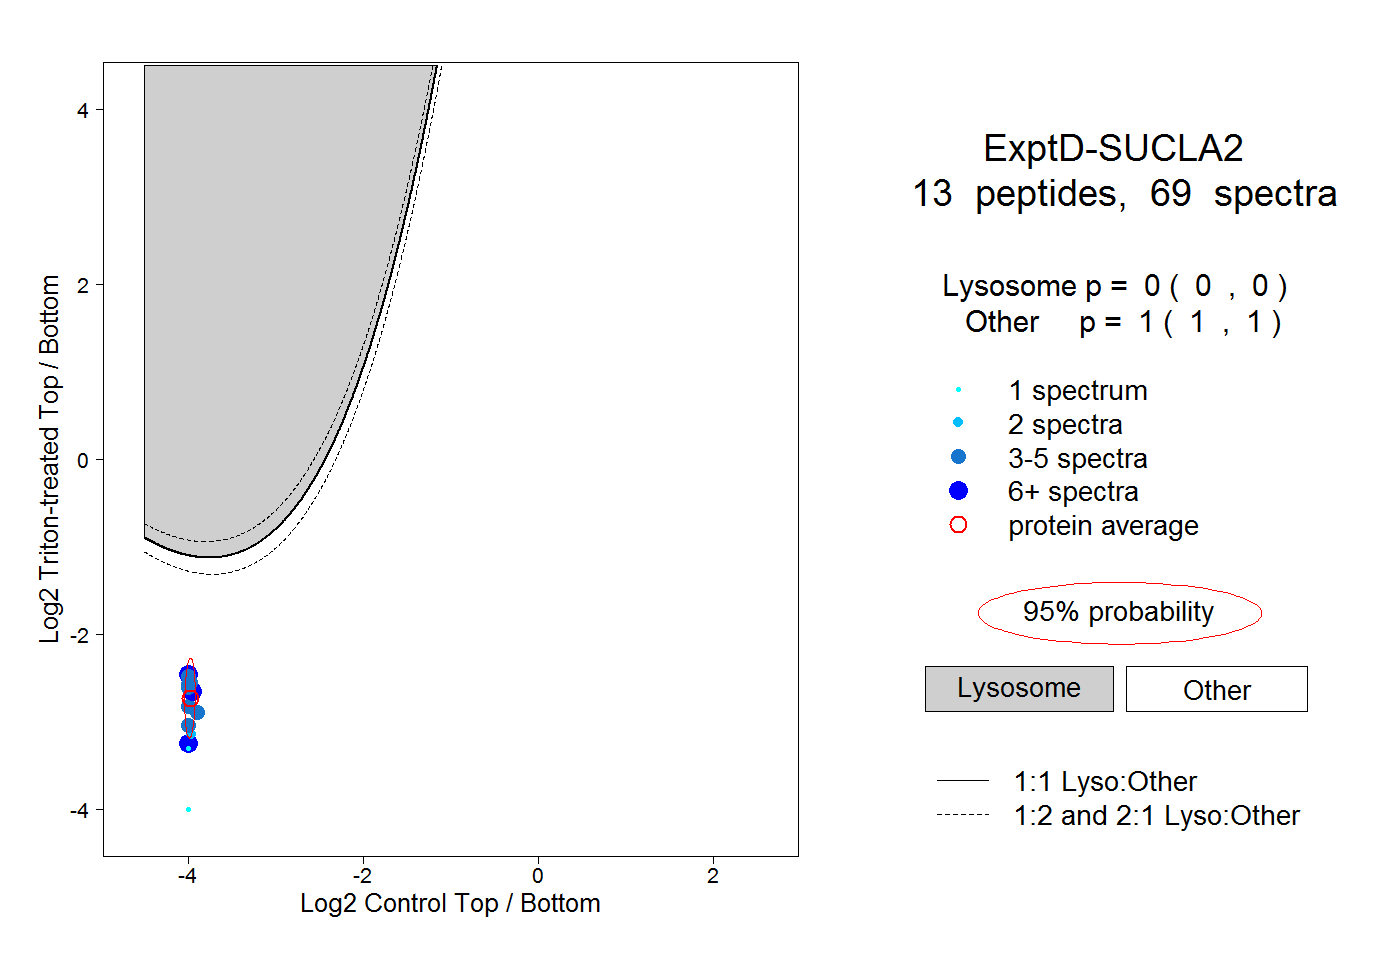 |
0.000 0.000 | 0.000 |
1.000 1.000 | 1.000 |