 1
1peptide
spectrum
NA | NA
NA | NA
NA | NA
NA | NA
NA | NA
NA | NA
NA | NA
NA | NA
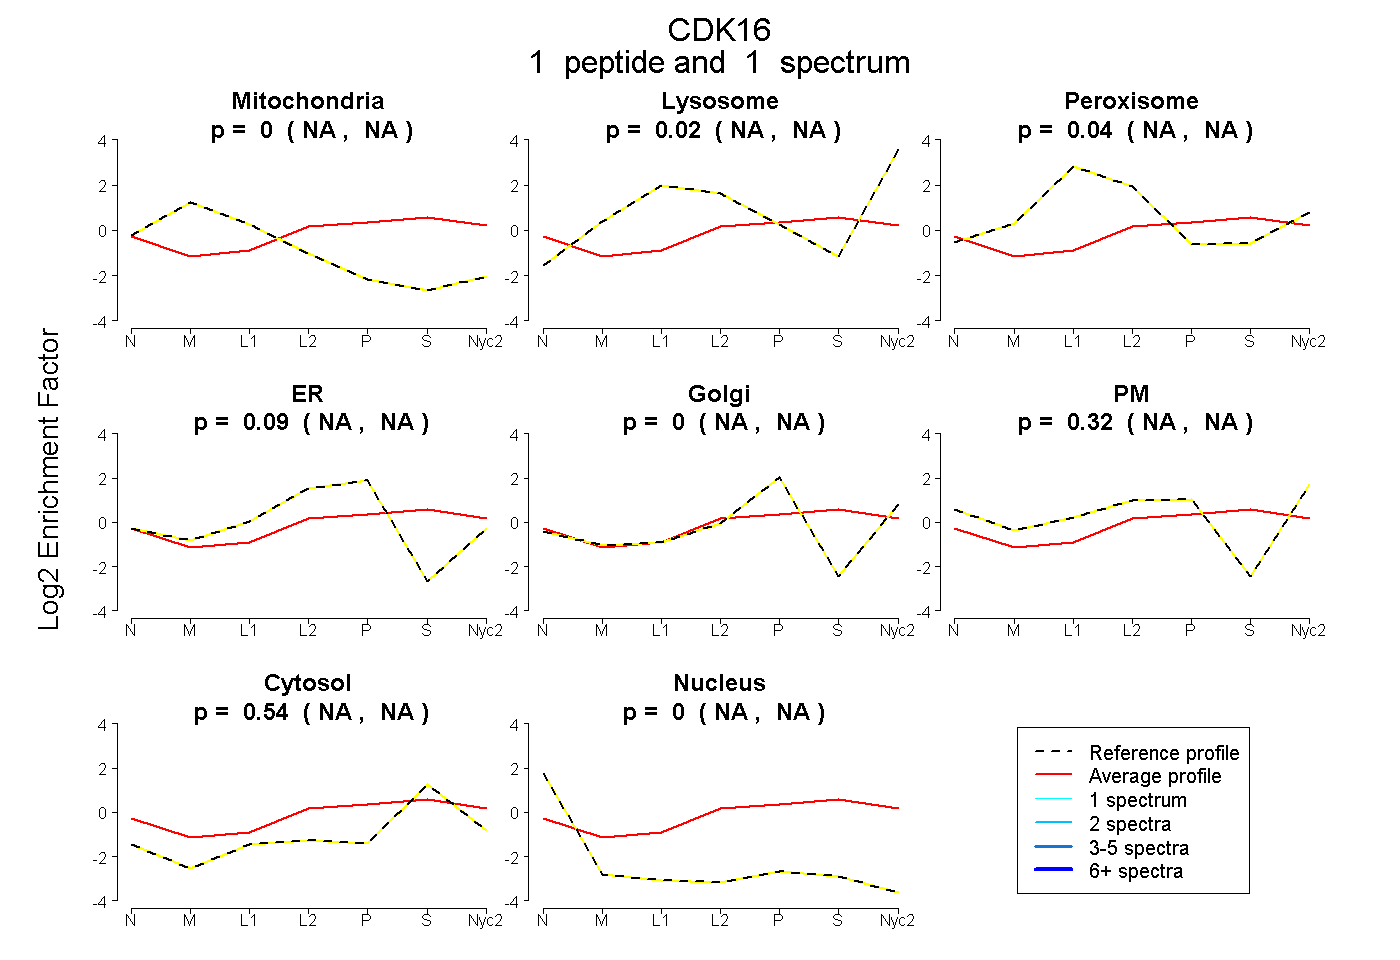
| Plot | Mito | Lyso | Perox | ER | Golgi | PM | Cytosol | Nucleus | |||||
| Expt A |
1 peptide |
1 spectrum |
|
0.000 NA | NA |
0.016 NA | NA |
0.036 NA | NA |
0.089 NA | NA |
0.000 NA | NA |
0.316 NA | NA |
0.543 NA | NA |
0.000 NA | NA |
| 1 spectrum, LLQFEGR | 0.000 | 0.016 | 0.036 | 0.089 | 0.000 | 0.316 | 0.543 | 0.000 |