 23
23peptides
spectra
0.000 | 0.000
0.027 | 0.041
0.000 | 0.000
0.273 | 0.297
0.000 | 0.000
0.666 | 0.691
0.000 | 0.000
0.000 | 0.000
| Plot | Mito | Lyso | Perox | ER | Golgi | PM | Cytosol | Nucleus | |||||
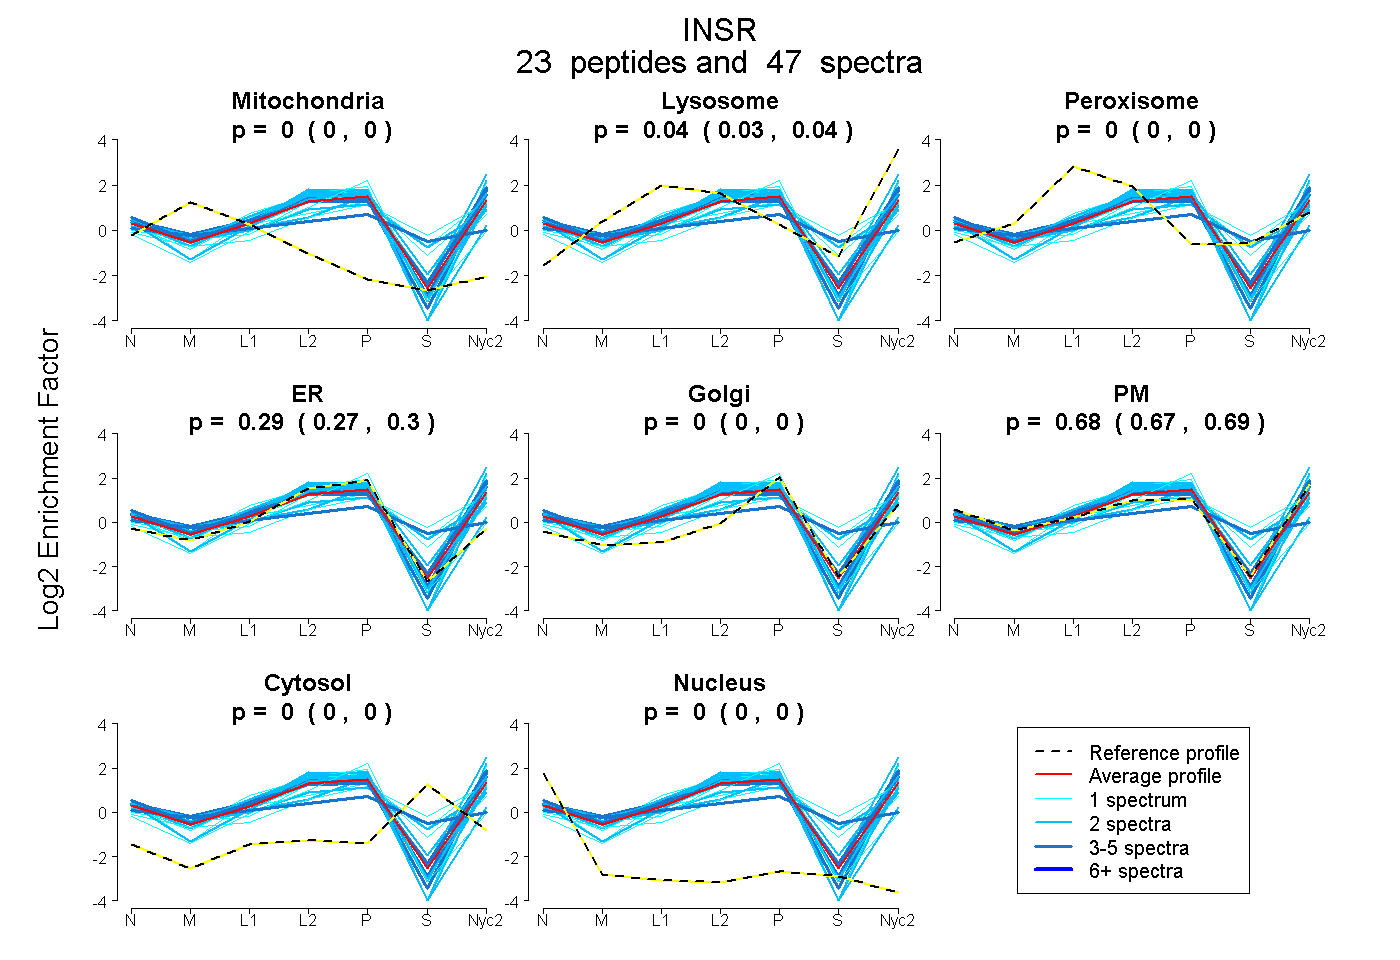
| Expt A |
23 peptides |
47 spectra |
|
0.000 0.000 | 0.000 |
0.035 0.027 | 0.041 |
0.000 0.000 | 0.000 |
0.286 0.273 | 0.297 |
0.000 0.000 | 0.000 |
0.679 0.666 | 0.691 |
0.000 0.000 | 0.000 |
0.000 0.000 | 0.000 |
| 3 spectra, YGDEELHLCVSR | 0.042 | 0.000 | 0.244 | 0.148 | 0.185 | 0.146 | 0.234 | 0.000 | ||
| 1 spectrum, DIYETDYYR | 0.000 | 0.000 | 0.159 | 0.000 | 0.218 | 0.521 | 0.102 | 0.000 | ||
| 1 spectrum, ESLVISGLR | 0.000 | 0.000 | 0.000 | 0.213 | 0.000 | 0.787 | 0.000 | 0.000 | ||
| 2 spectra, MEEVSGTK | 0.008 | 0.000 | 0.000 | 0.142 | 0.230 | 0.617 | 0.000 | 0.003 | ||
| 4 spectra, LFFHYNPK | 0.000 | 0.000 | 0.000 | 0.096 | 0.000 | 0.904 | 0.000 | 0.000 | ||
| 2 spectra, SHGCTAEGLCCHK | 0.000 | 0.000 | 0.085 | 0.371 | 0.000 | 0.544 | 0.000 | 0.000 | ||
| 2 spectra, HFALER | 0.000 | 0.023 | 0.000 | 0.124 | 0.000 | 0.853 | 0.000 | 0.000 | ||
| 2 spectra, TNGDQASCENELLK | 0.000 | 0.000 | 0.000 | 0.273 | 0.000 | 0.727 | 0.000 | 0.000 | ||
| 2 spectra, MCWQFNPK | 0.000 | 0.000 | 0.000 | 0.769 | 0.000 | 0.231 | 0.000 | 0.000 | ||
| 2 spectra, GLLPVR | 0.000 | 0.023 | 0.000 | 0.176 | 0.000 | 0.801 | 0.000 | 0.000 | ||
| 2 spectra, VLTLPR | 0.000 | 0.066 | 0.000 | 0.198 | 0.121 | 0.603 | 0.013 | 0.000 | ||
| 1 spectrum, ELGQGSFGMVYEGNAK | 0.000 | 0.035 | 0.013 | 0.276 | 0.016 | 0.660 | 0.000 | 0.000 | ||
| 1 spectrum, TNCPATVINGQFVER | 0.000 | 0.169 | 0.000 | 0.000 | 0.195 | 0.361 | 0.276 | 0.000 | ||
| 5 spectra, TIDSVTSAQELR | 0.000 | 0.102 | 0.000 | 0.101 | 0.000 | 0.798 | 0.000 | 0.000 | ||
| 1 spectrum, IELQACNQDSPEER | 0.000 | 0.000 | 0.043 | 0.440 | 0.000 | 0.469 | 0.049 | 0.000 | ||
| 1 spectrum, IGDFGMTR | 0.000 | 0.000 | 0.000 | 0.183 | 0.000 | 0.817 | 0.000 | 0.000 | ||
| 4 spectra, VCQILEGEK | 0.000 | 0.032 | 0.016 | 0.110 | 0.000 | 0.842 | 0.000 | 0.000 | ||
| 2 spectra, VCPTICK | 0.000 | 0.006 | 0.177 | 0.073 | 0.163 | 0.423 | 0.160 | 0.000 | ||
| 2 spectra, MRPTFLEIVNLLK | 0.000 | 0.159 | 0.000 | 0.000 | 0.000 | 0.841 | 0.000 | 0.000 | ||
| 1 spectrum, TWSPPFESDDSQK | 0.000 | 0.197 | 0.000 | 0.199 | 0.007 | 0.432 | 0.165 | 0.000 | ||
| 2 spectra, CSVAAYVSAR | 0.000 | 0.000 | 0.000 | 0.409 | 0.000 | 0.591 | 0.000 | 0.000 | ||
| 3 spectra, LLGVVSK | 0.000 | 0.055 | 0.000 | 0.164 | 0.000 | 0.780 | 0.000 | 0.000 | ||
| 1 spectrum, WMSPESLK | 0.000 | 0.000 | 0.000 | 0.735 | 0.258 | 0.000 | 0.000 | 0.008 |
| Plot | Mito | Lyso or Perox | ER | Golgi | PM | Cytosol | Nucleus | ||||||
| Expt B |
2 peptides |
3 spectra |
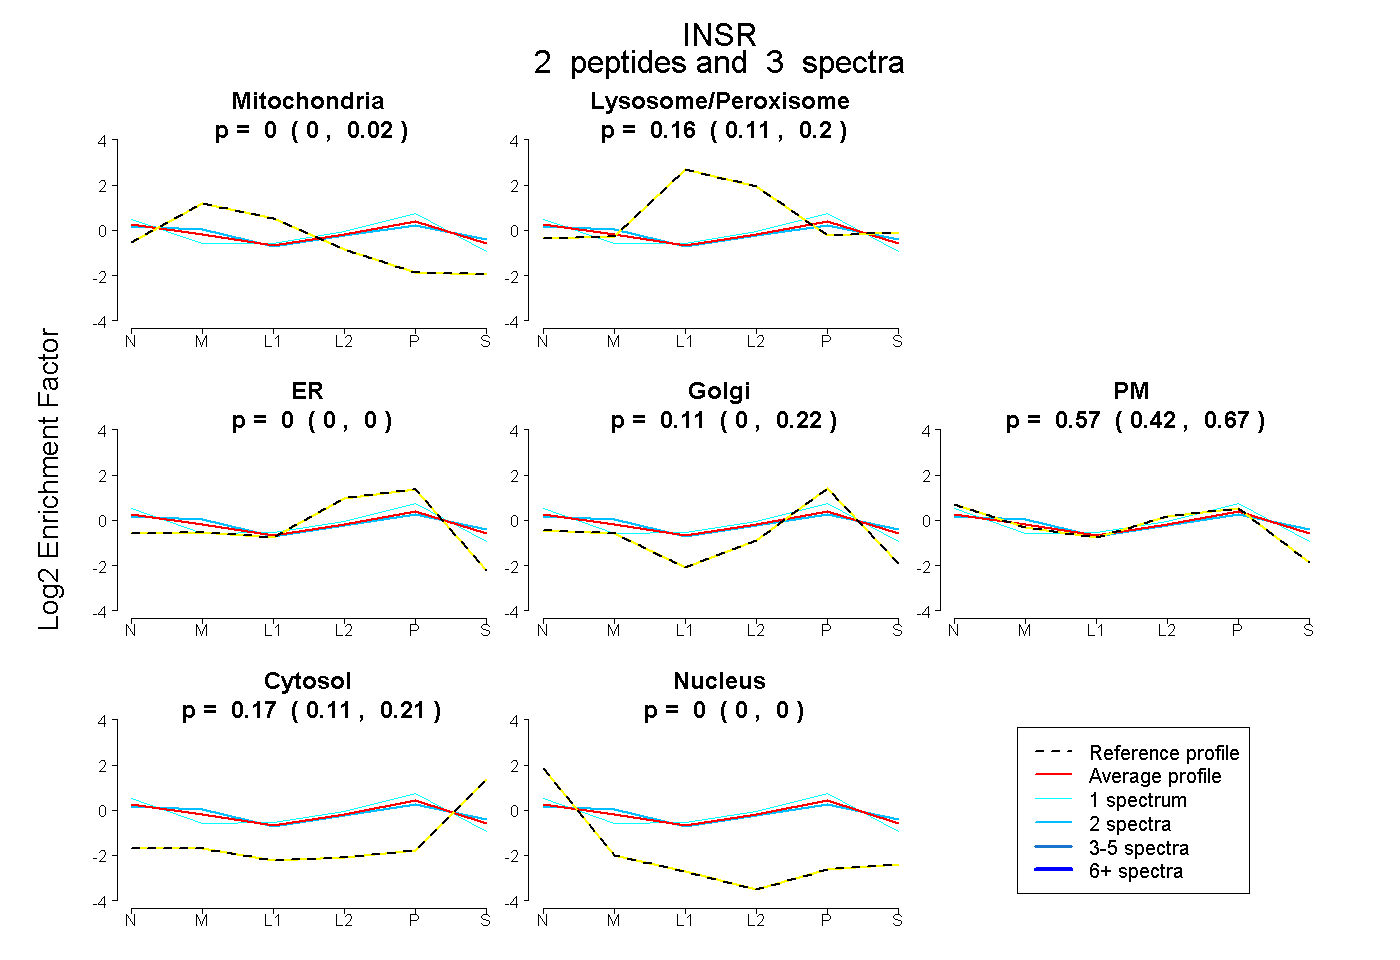 |
0.000 0.000 | 0.021 |
0.156 0.105 | 0.201 |
0.000 0.000 | 0.000 |
0.108 0.000 | 0.222 |
0.568 0.418 | 0.673 |
0.168 0.111 | 0.207 |
0.000 0.000 | 0.000 |
|||
| Plot | Lyso | Other | |||||||||||
| Expt C |
23 peptides |
63 spectra |
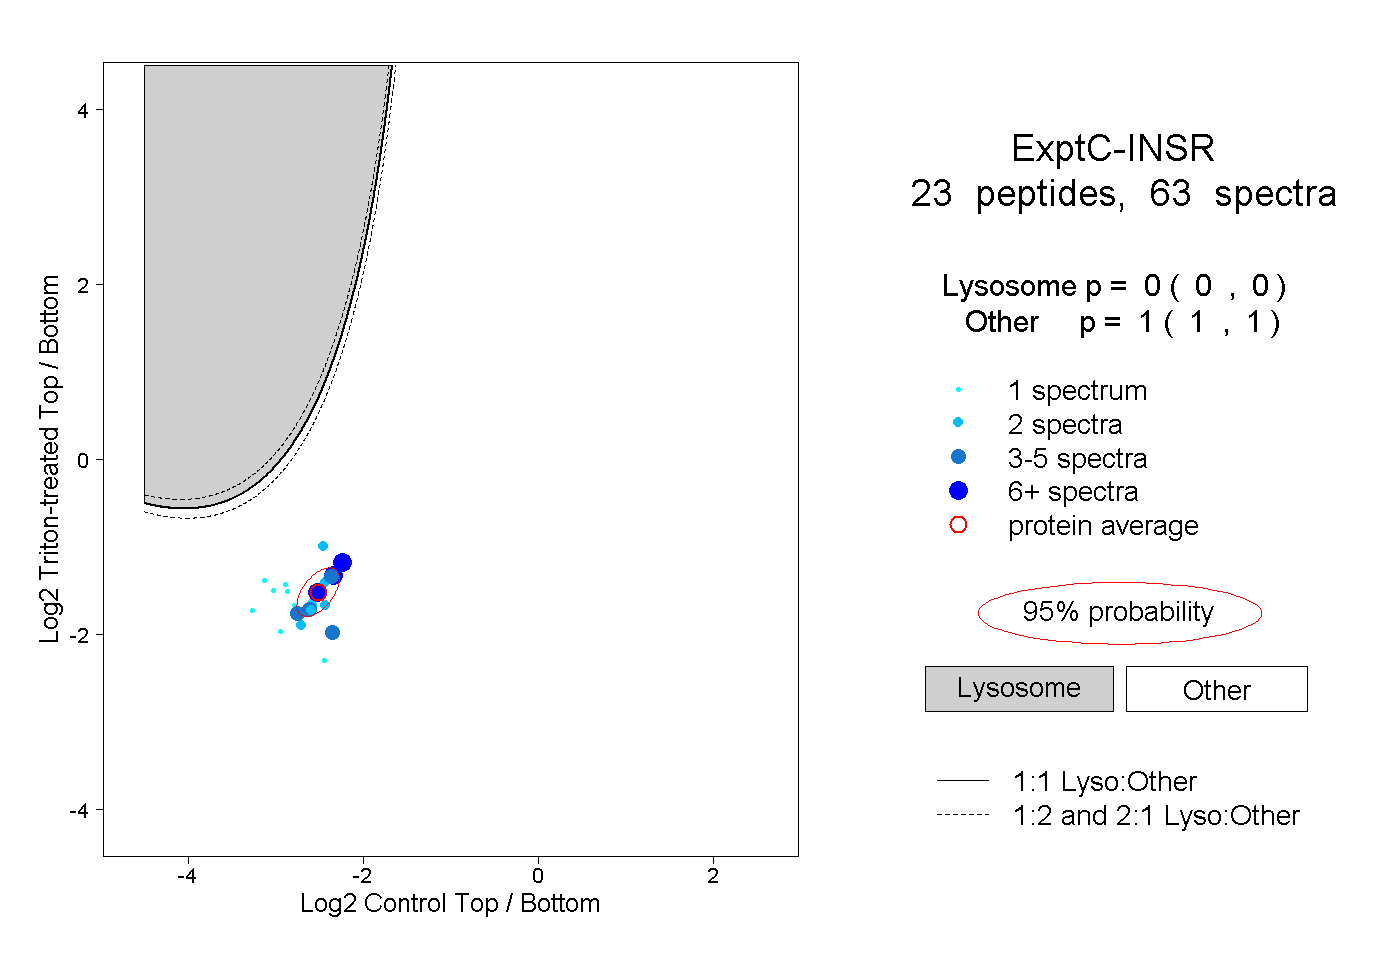 |
0.000 0.000 | 0.000 |
1.000 1.000 | 1.000 |
||||||||
| Plot | Lyso | Other | |||||||||||
| Expt D |
6 peptides |
9 spectra |
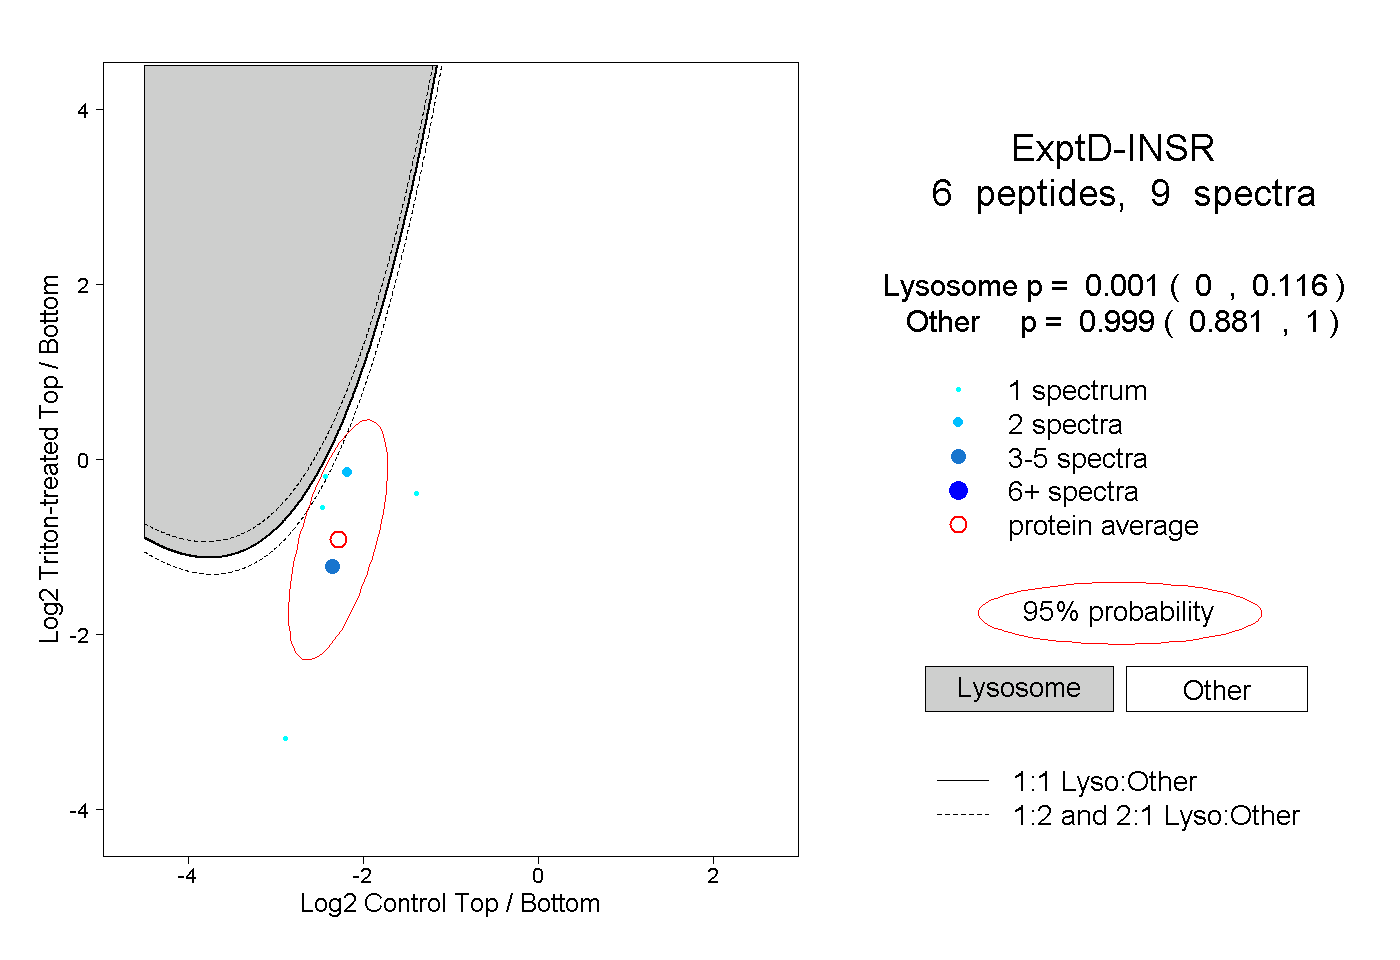 |
0.001 0.000 | 0.116 |
0.999 0.881 | 1.000 |