 3
3peptides
spectra
0.000 | 0.000
0.101 | 0.260
0.000 | 0.079
0.000 | 0.000
0.000 | 0.098
0.618 | 0.853
0.000 | 0.074
0.000 | 0.000
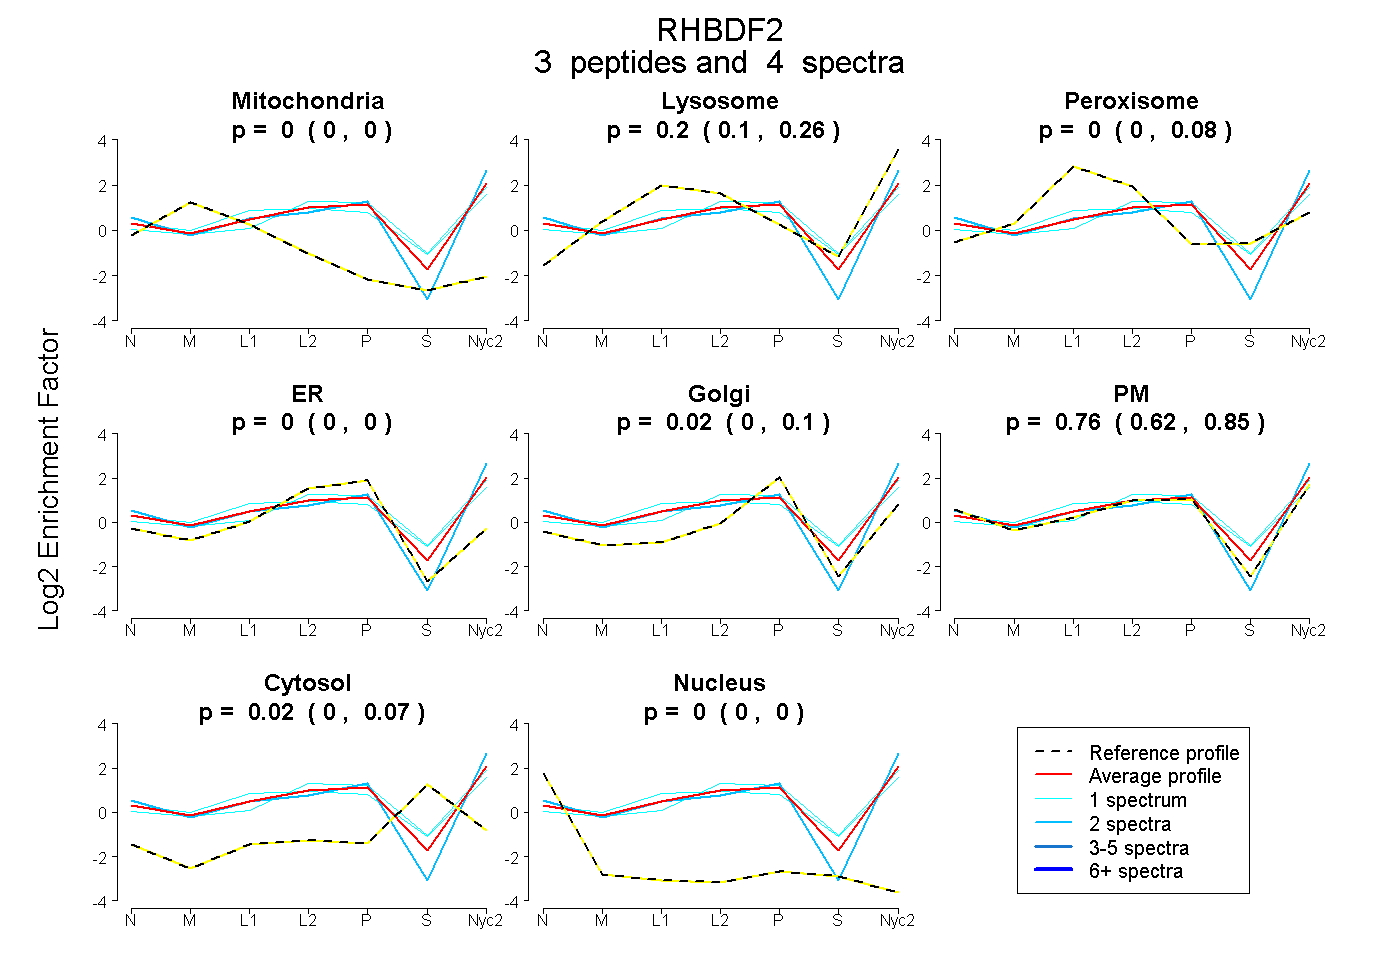
| Plot | Mito | Lyso | Perox | ER | Golgi | PM | Cytosol | Nucleus | |||||
| Expt A |
3 peptides |
4 spectra |
|
0.000 0.000 | 0.000 |
0.195 0.101 | 0.260 |
0.000 0.000 | 0.079 |
0.000 0.000 | 0.000 |
0.017 0.000 | 0.098 |
0.764 0.618 | 0.853 |
0.024 0.000 | 0.074 |
0.000 0.000 | 0.000 |