 1
1peptide
spectra
0.044 | 0.075
0.000 | 0.000
0.385 | 0.426
0.000 | 0.002
0.360 | 0.416
0.062 | 0.141
0.016 | 0.050
0.000 | 0.000
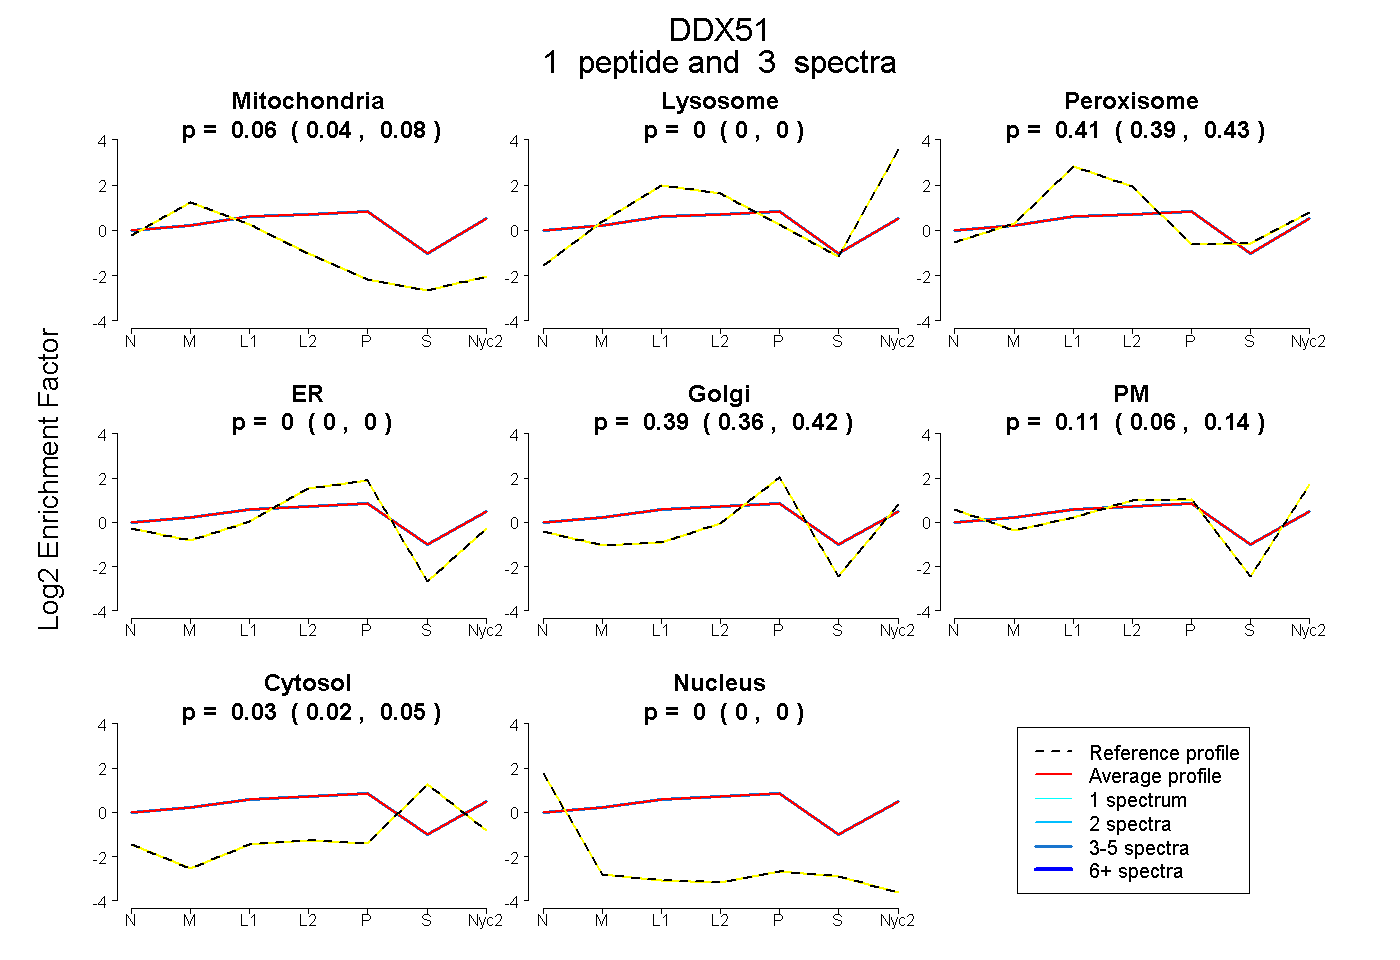
| Plot | Mito | Lyso | Perox | ER | Golgi | PM | Cytosol | Nucleus | |||||
| Expt A |
1 peptide |
3 spectra |
|
0.061 0.044 | 0.075 |
0.000 0.000 | 0.000 |
0.407 0.385 | 0.426 |
0.000 0.000 | 0.002 |
0.391 0.360 | 0.416 |
0.106 0.062 | 0.141 |
0.035 0.016 | 0.050 |
0.000 0.000 | 0.000 |