 6
6peptides
spectra
0.000 | 0.000
0.000 | 0.000
0.000 | 0.000
0.727 | 0.742
0.000 | 0.000
0.000 | 0.000
0.233 | 0.257
0.010 | 0.026
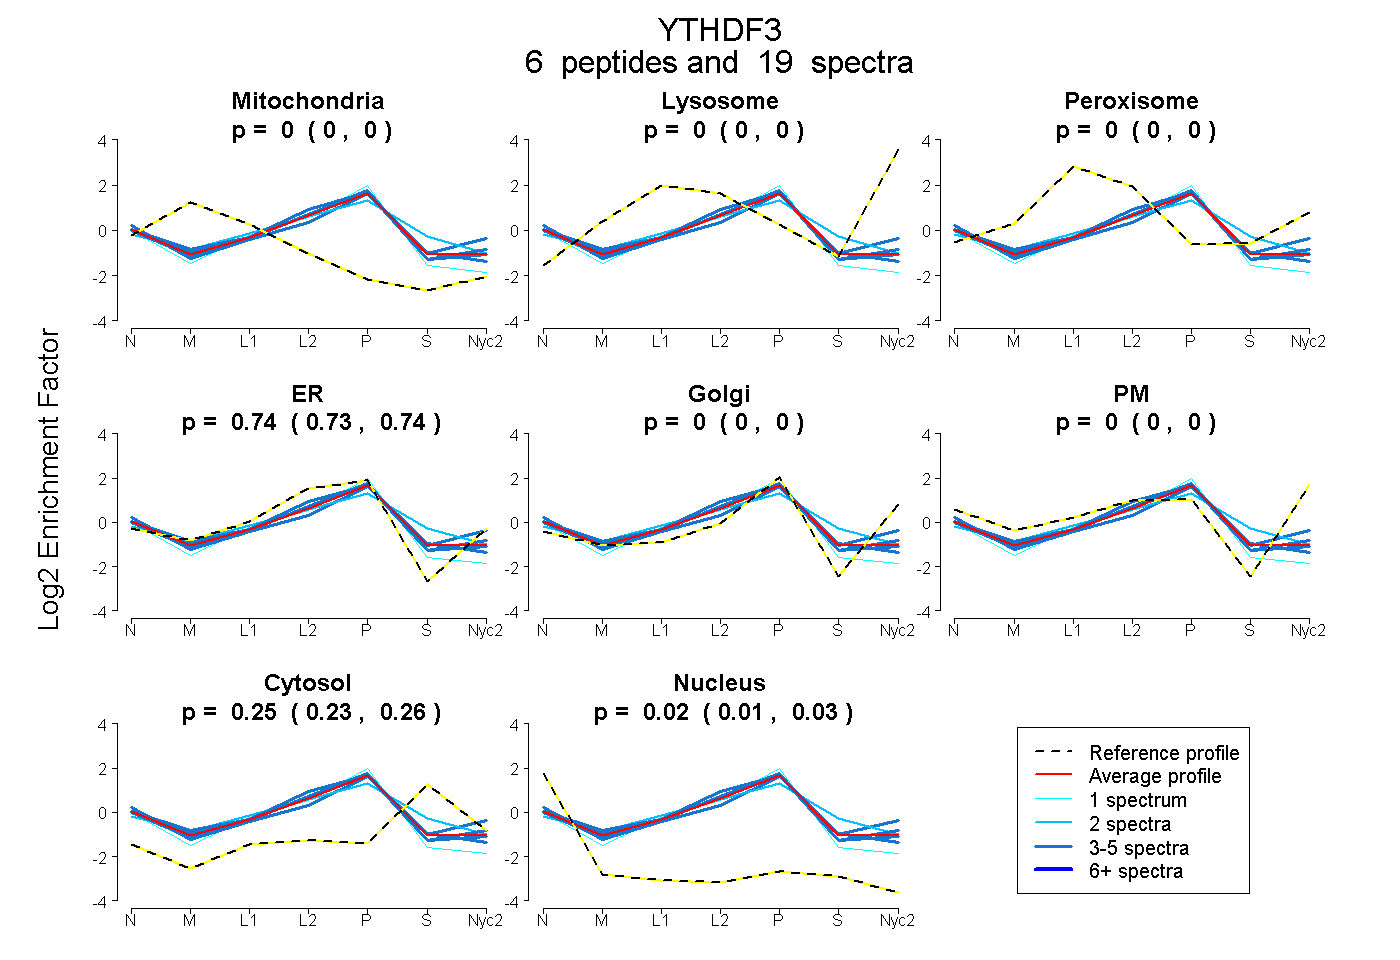
| Plot | Mito | Lyso | Perox | ER | Golgi | PM | Cytosol | Nucleus | |||||
| Expt A |
6 peptides |
19 spectra |
|
0.000 0.000 | 0.000 |
0.000 0.000 | 0.000 |
0.000 0.000 | 0.000 |
0.735 0.727 | 0.742 |
0.000 0.000 | 0.000 |
0.000 0.000 | 0.000 |
0.246 0.233 | 0.257 |
0.019 0.010 | 0.026 |
| 1 spectrum, AINNYNPK | 0.000 | 0.000 | 0.000 | 0.764 | 0.000 | 0.000 | 0.127 | 0.109 | ||
| 4 spectra, DVPNNQLR | 0.000 | 0.000 | 0.000 | 0.769 | 0.000 | 0.000 | 0.201 | 0.029 | ||
| 5 spectra, SYSEDDIHR | 0.000 | 0.000 | 0.000 | 0.720 | 0.000 | 0.000 | 0.248 | 0.032 | ||
| 2 spectra, DTQEVPLEK | 0.000 | 0.000 | 0.077 | 0.584 | 0.000 | 0.000 | 0.339 | 0.000 | ||
| 3 spectra, DFDWNLK | 0.000 | 0.000 | 0.000 | 0.516 | 0.197 | 0.032 | 0.250 | 0.004 | ||
| 4 spectra, LLATFK | 0.000 | 0.000 | 0.000 | 0.792 | 0.000 | 0.000 | 0.204 | 0.004 |
| Plot | Mito | Lyso or Perox | ER | Golgi | PM | Cytosol | Nucleus | ||||||
| Expt B |
1 peptide |
1 spectrum |
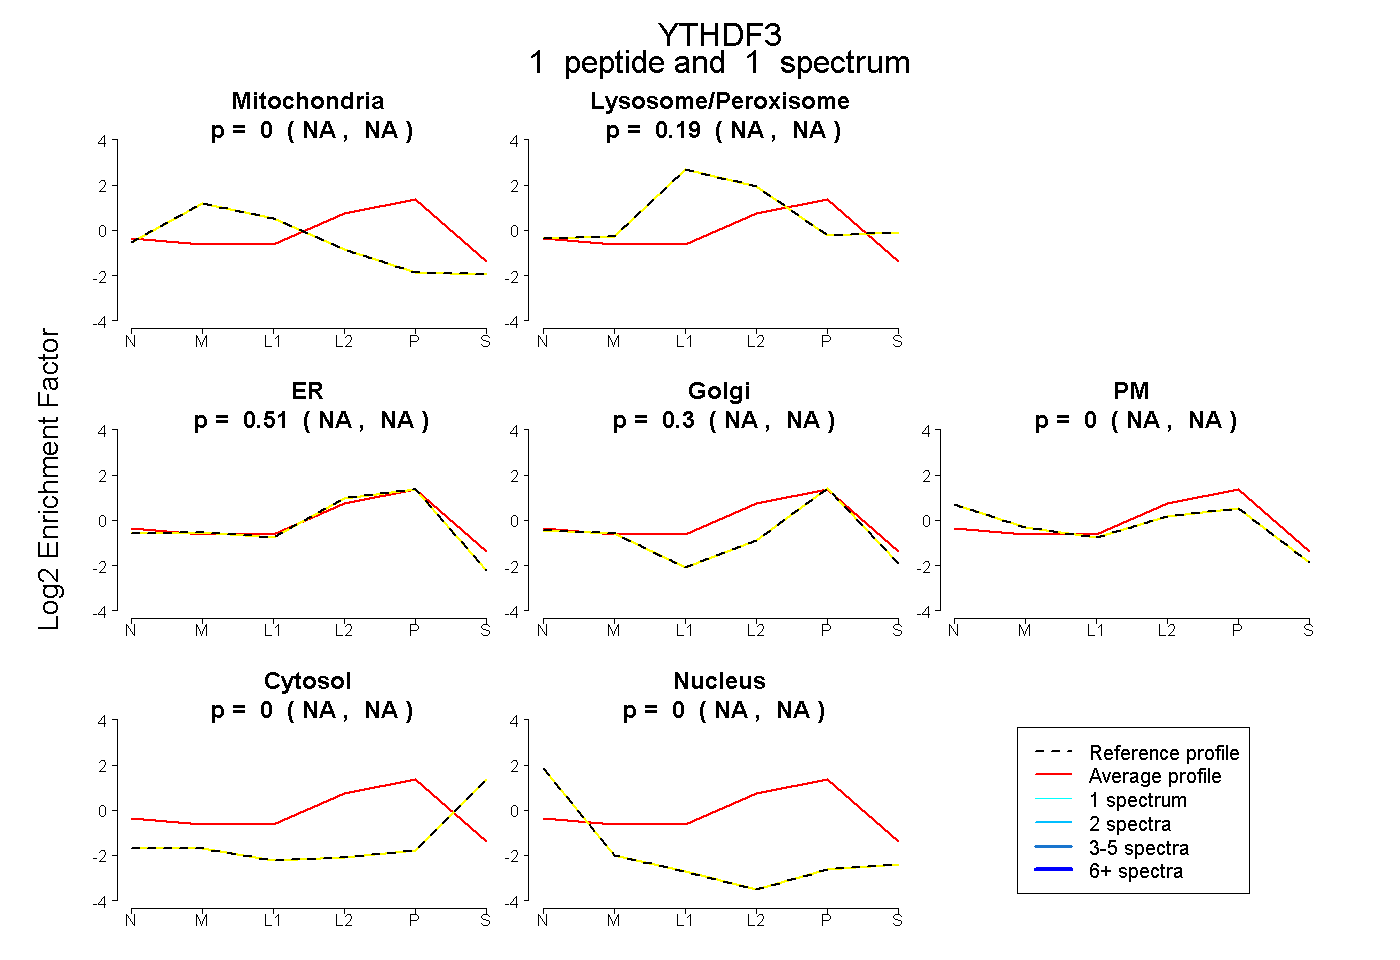 |
0.000 NA | NA |
0.190 NA | NA |
0.507 NA | NA |
0.299 NA | NA |
0.000 NA | NA |
0.003 NA | NA |
0.000 NA | NA |
|||
| Plot | Lyso | Other | |||||||||||
| Expt C |
7 peptides |
19 spectra |
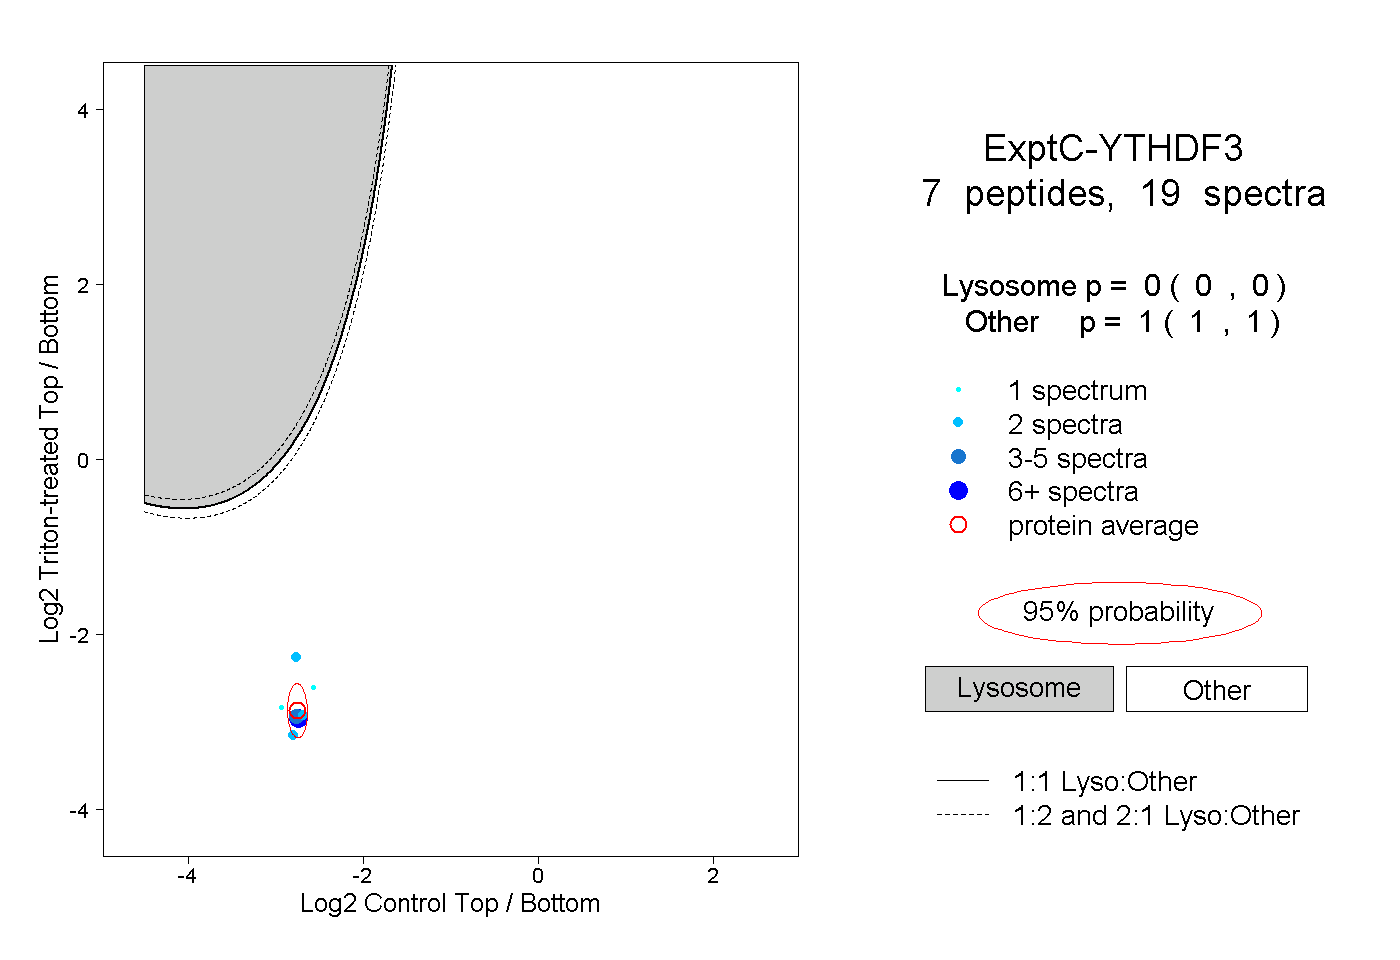 |
0.000 0.000 | 0.000 |
1.000 1.000 | 1.000 |
||||||||
| Plot | Lyso | Other | |||||||||||
| Expt D |
4 peptides |
9 spectra |
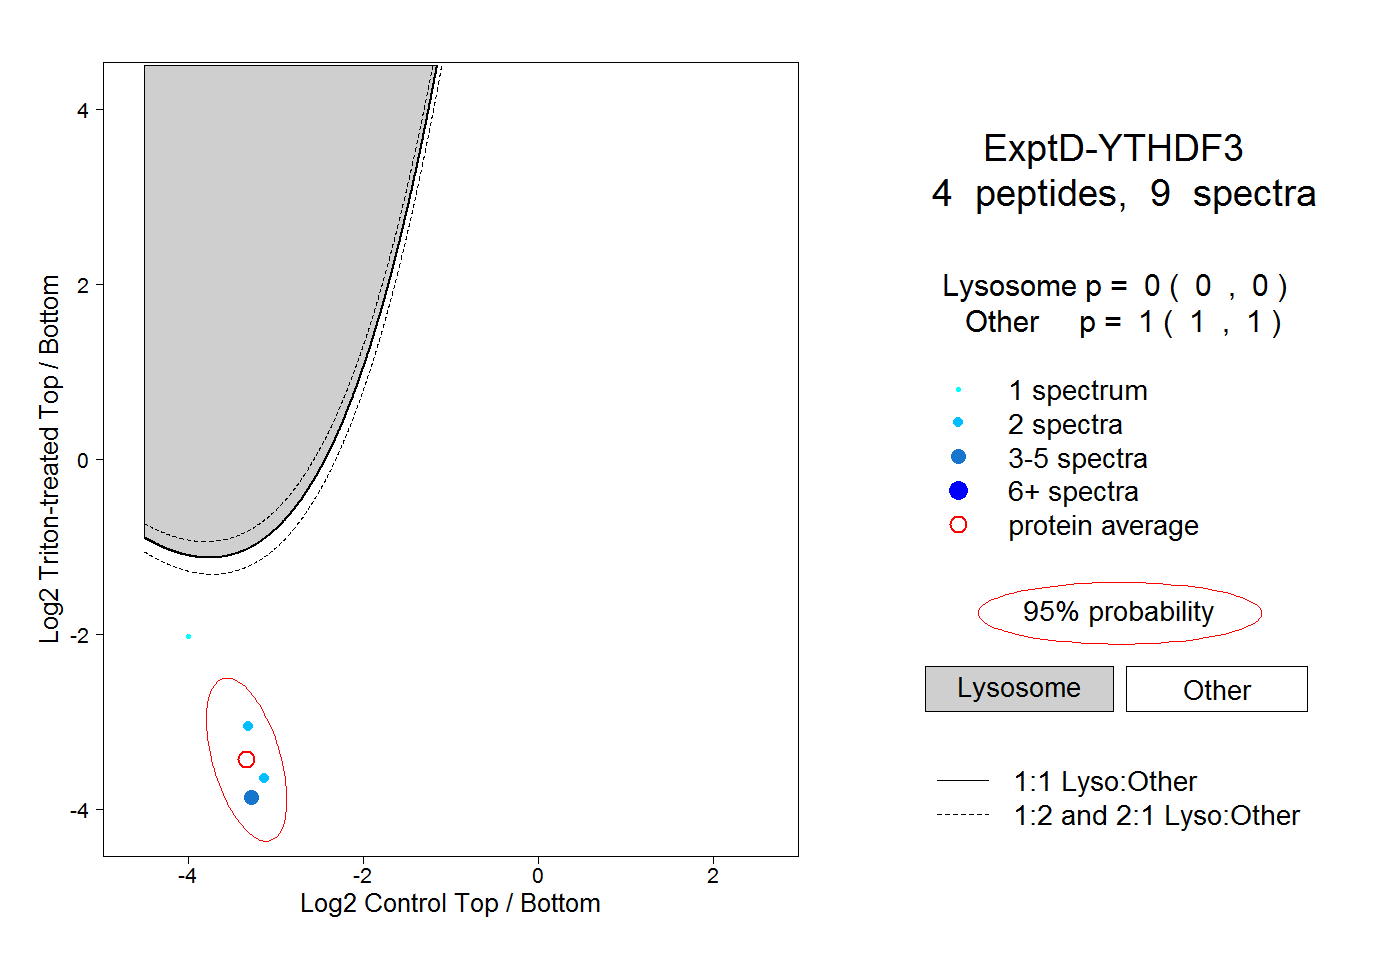 |
0.000 0.000 | 0.000 |
1.000 1.000 | 1.000 |