 1
1peptide
spectrum
NA | NA
NA | NA
NA | NA
NA | NA
NA | NA
NA | NA
NA | NA
NA | NA
4peptides
spectra
0.000 | 1.000
0.000 | 1.000
| Plot | Mito | Lyso | Perox | ER | Golgi | PM | Cytosol | Nucleus | |||||
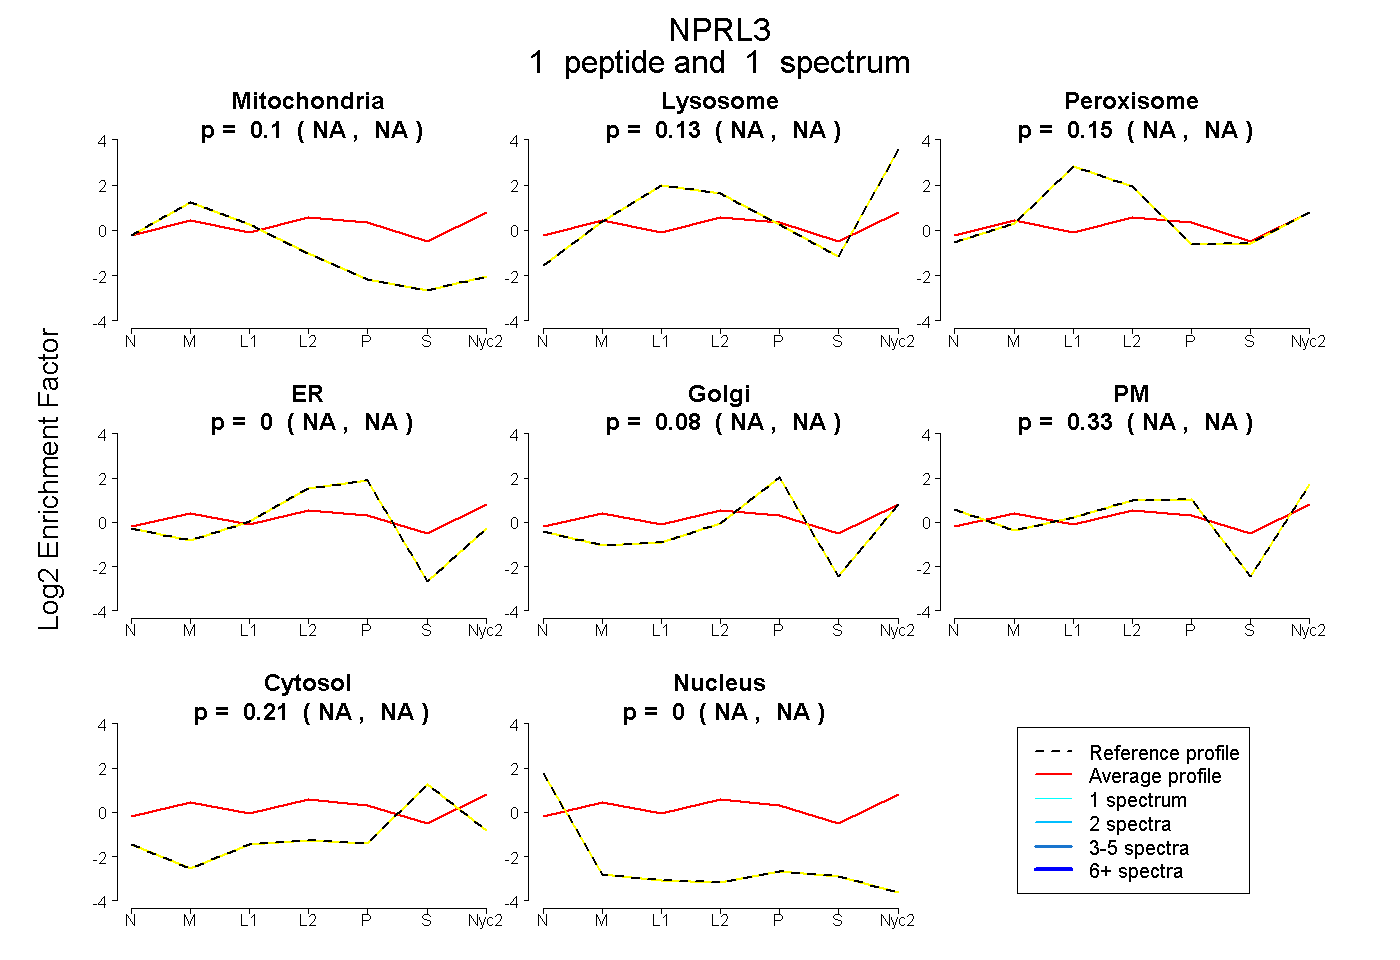
| Expt A |
1 peptide |
1 spectrum |
|
0.097 NA | NA |
0.132 NA | NA |
0.150 NA | NA |
0.000 NA | NA |
0.077 NA | NA |
0.335 NA | NA |
0.209 NA | NA |
0.000 NA | NA |
||
| Plot | Lyso | Other | |||||||||||
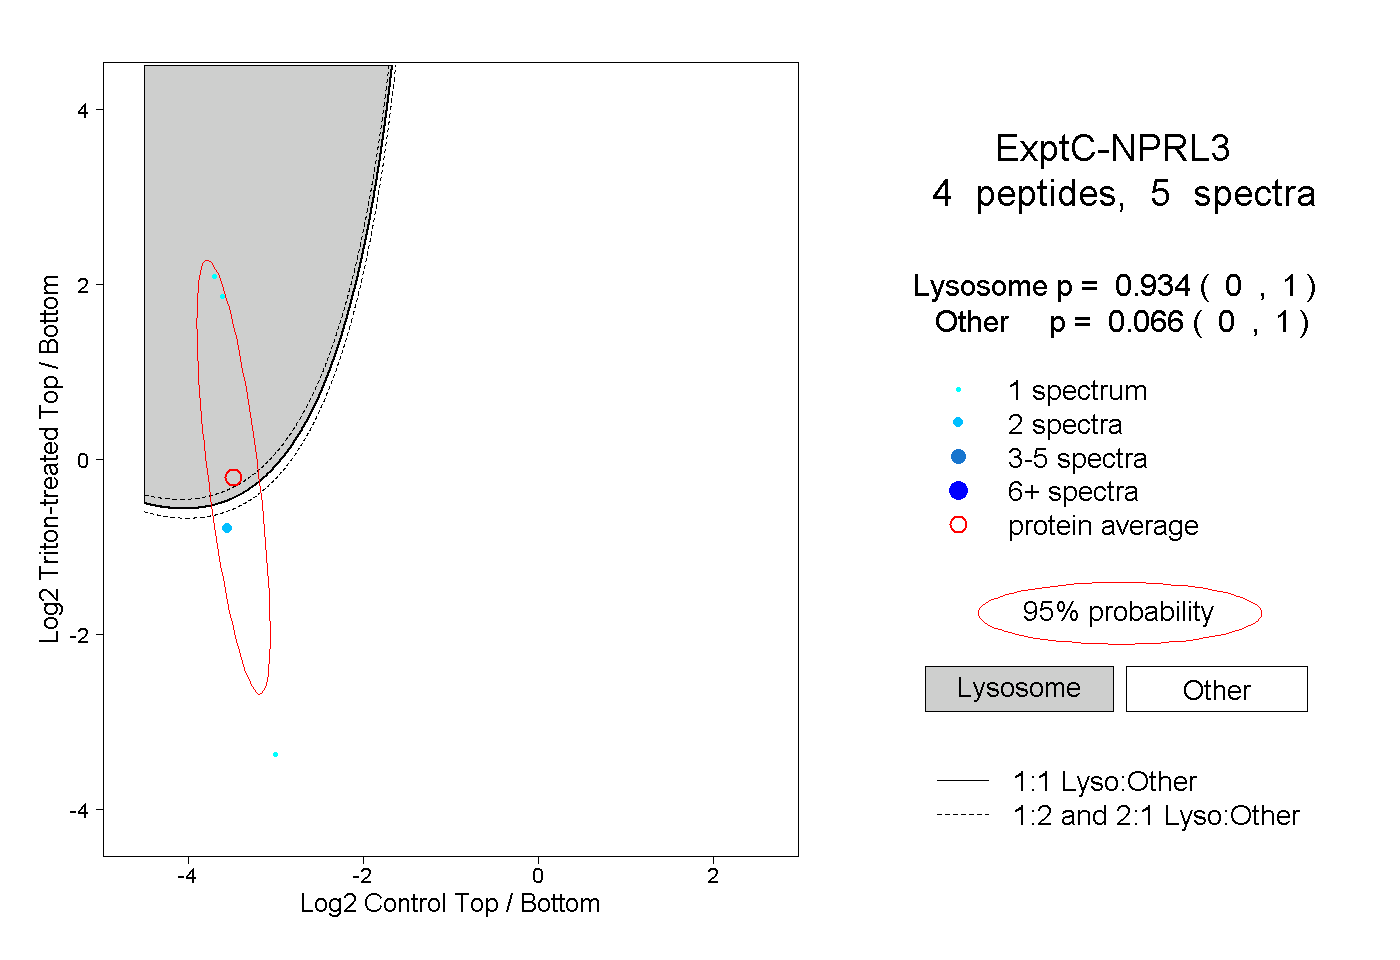
| Expt C |
4 peptides |
5 spectra |
|
0.934 0.000 | 1.000 |
0.066 0.000 | 1.000 |