 4
4peptides
spectra
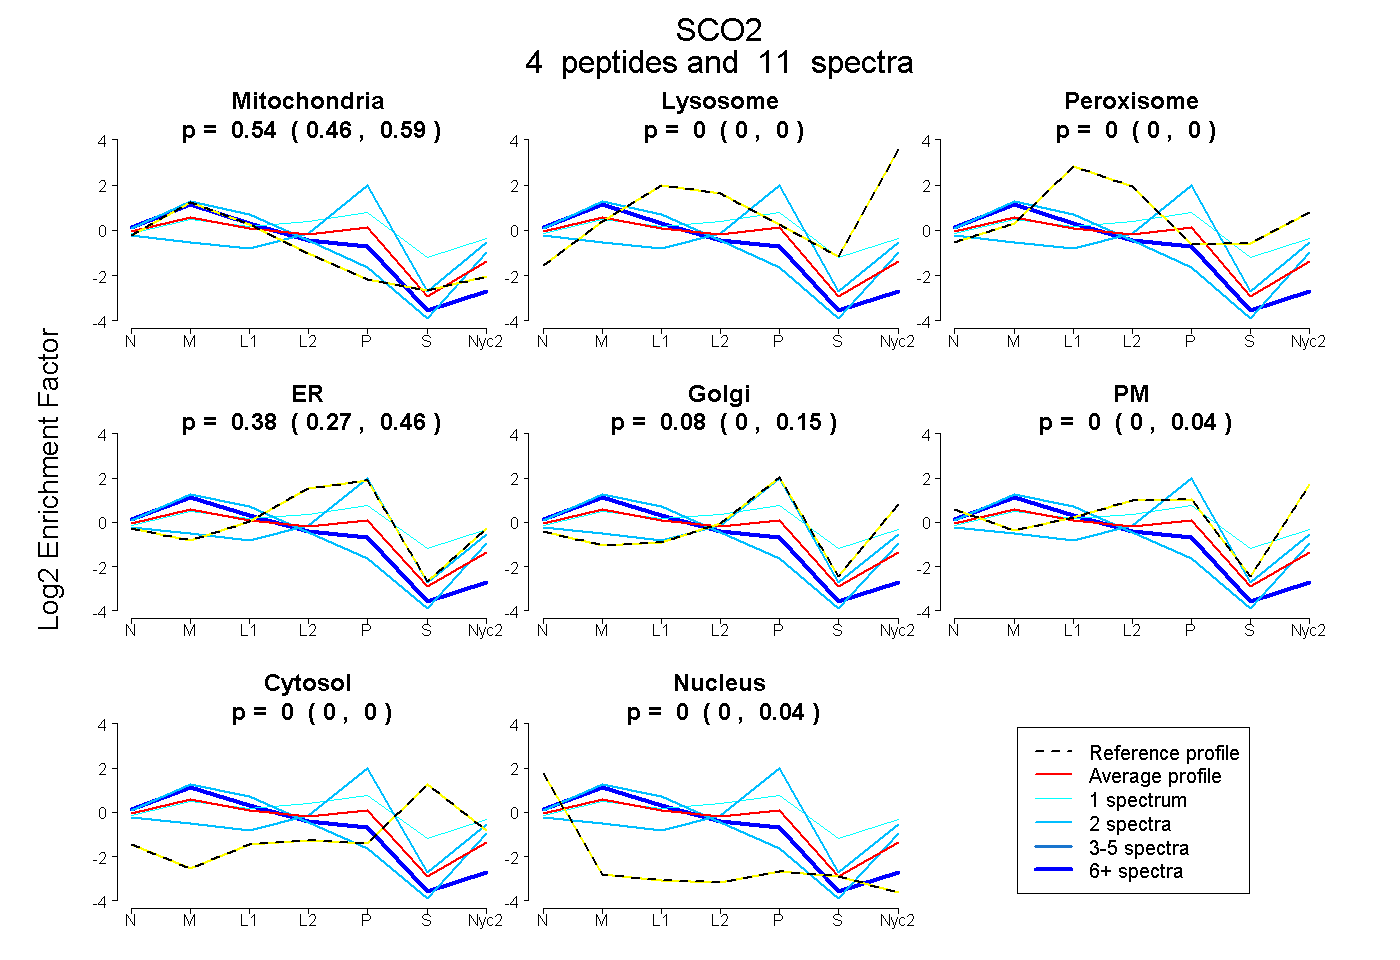
0.463 | 0.590
0.000 | 0.000
0.000 | 0.000
0.271 | 0.465
0.000 | 0.155
0.000 | 0.042
0.000 | 0.000
0.000 | 0.037
1peptide
spectra
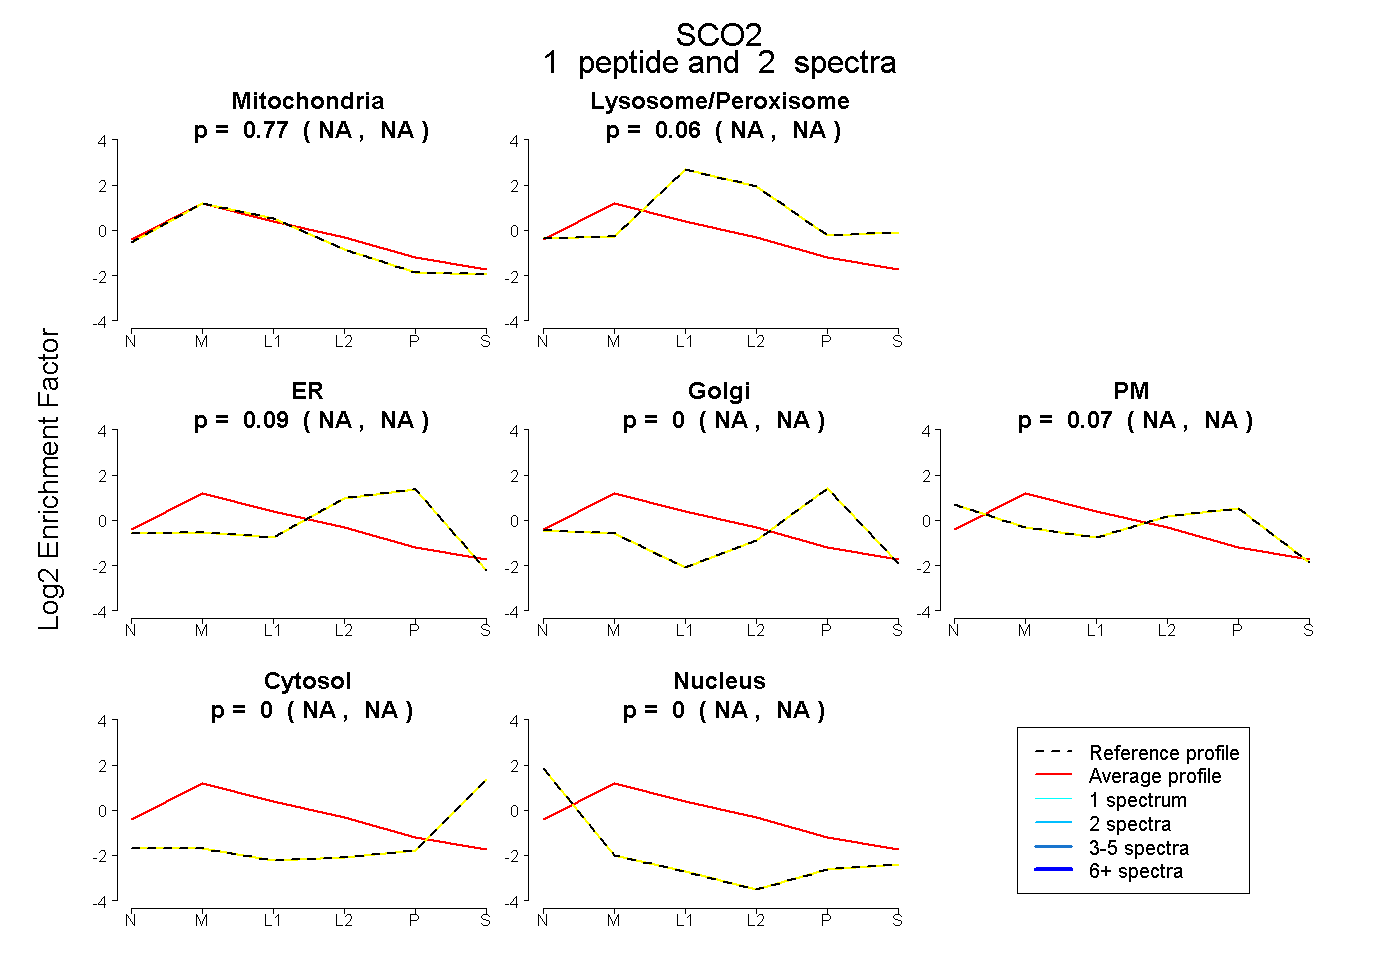
NA | NA
NA | NA
NA | NA
NA | NA
NA | NA
NA | NA
NA | NA
7peptides
spectra
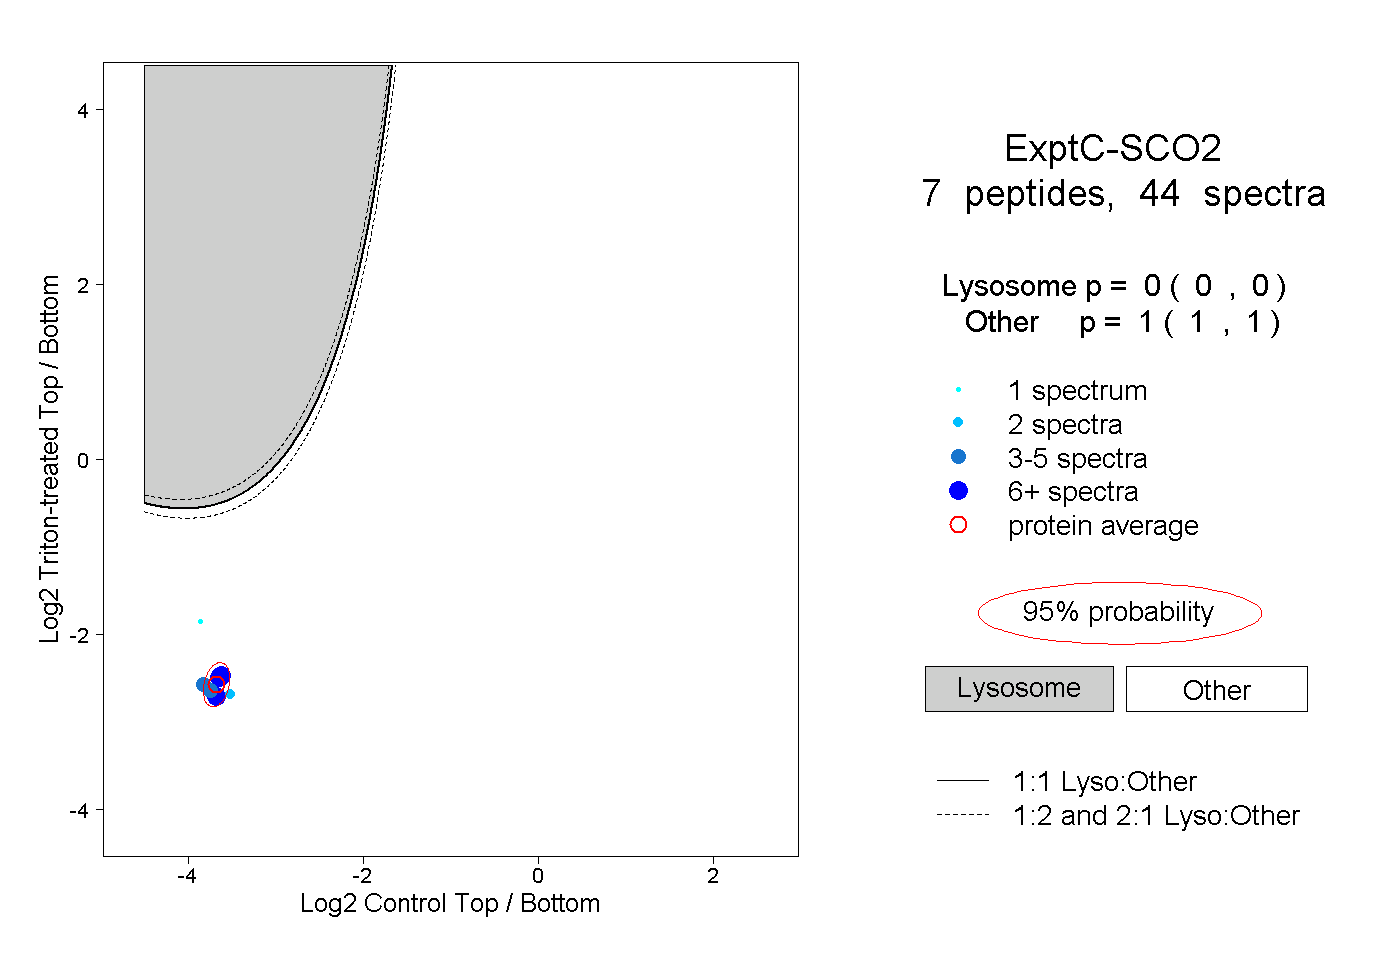
0.000 | 0.000
1.000 | 1.000
2peptides
spectra
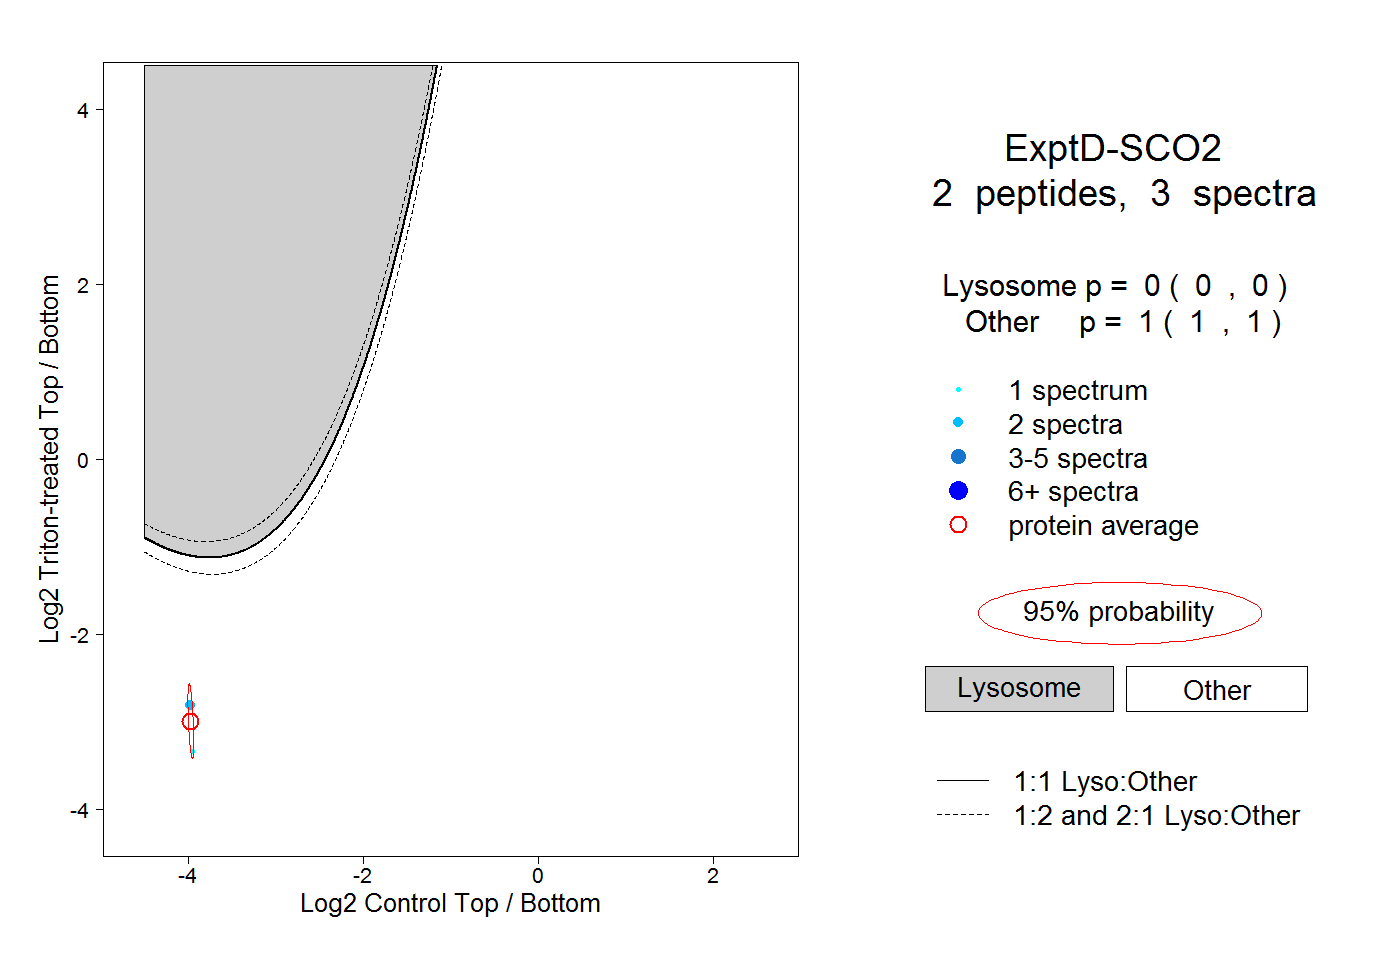
0.000 | 0.000
1.000 | 1.000