 6
6peptides
spectra
0.000 | 0.000
0.043 | 0.129
0.027 | 0.120
0.000 | 0.026
0.589 | 0.701
0.102 | 0.219
0.000 | 0.032
0.000 | 0.000
2peptides
spectra

0.000 | 0.000
1.000 | 1.000
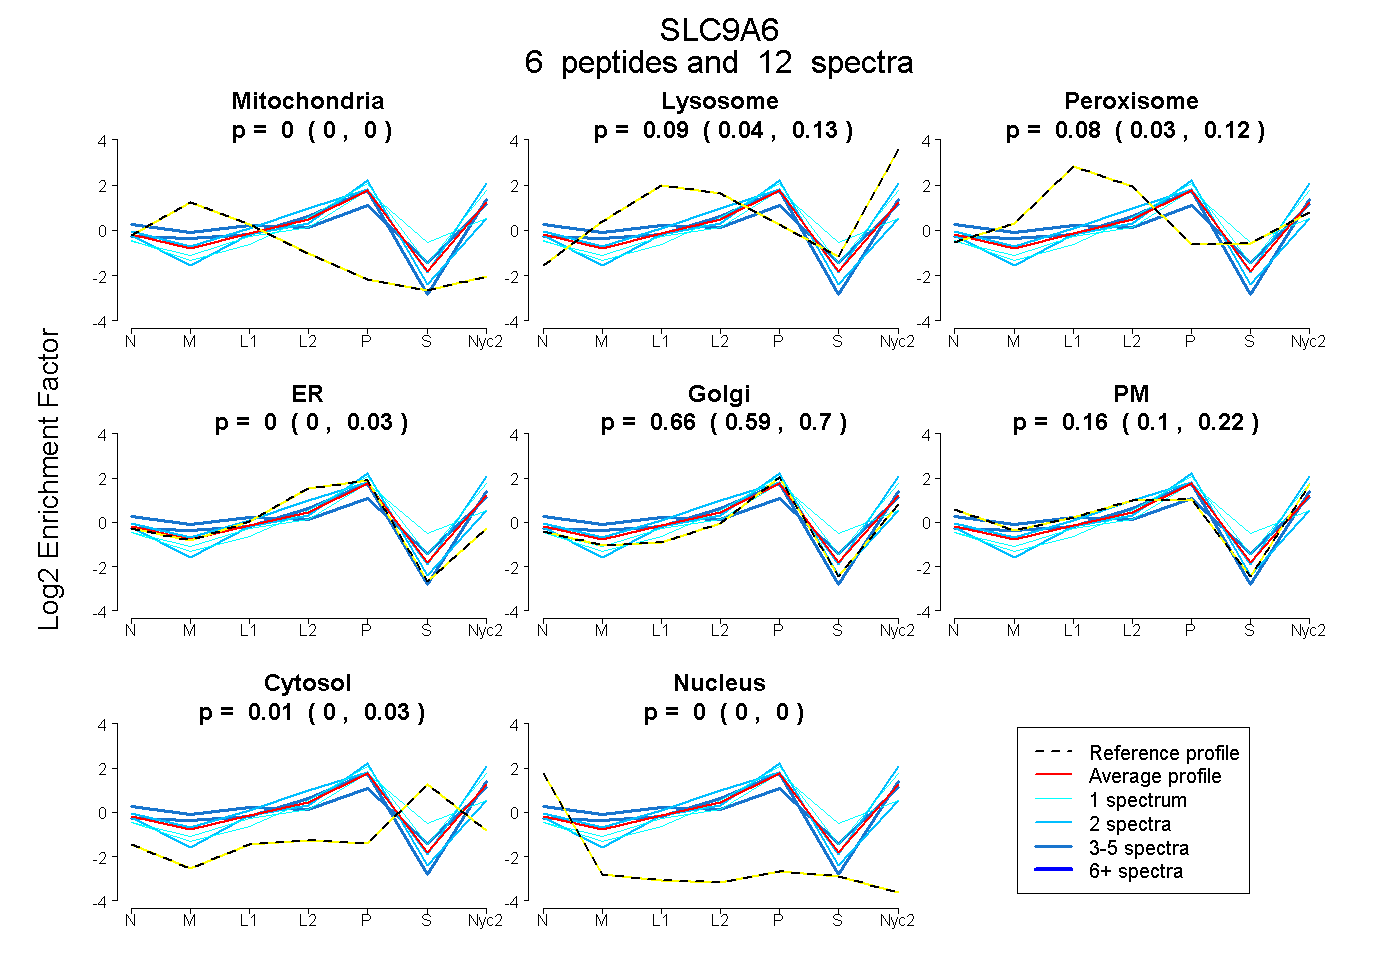
| Plot | Mito | Lyso | Perox | ER | Golgi | PM | Cytosol | Nucleus | |||||
| Expt A |
6 peptides |
12 spectra |
|
0.000 0.000 | 0.000 |
0.087 0.043 | 0.129 |
0.082 0.027 | 0.120 |
0.000 0.000 | 0.026 |
0.662 0.589 | 0.701 |
0.160 0.102 | 0.219 |
0.009 0.000 | 0.032 |
0.000 0.000 | 0.000 |
||
| Plot | Lyso | Other | |||||||||||
| Expt C |
2 peptides |
3 spectra |
|
0.000 0.000 | 0.000 |
1.000 1.000 | 1.000 |