5
5peptides
spectra
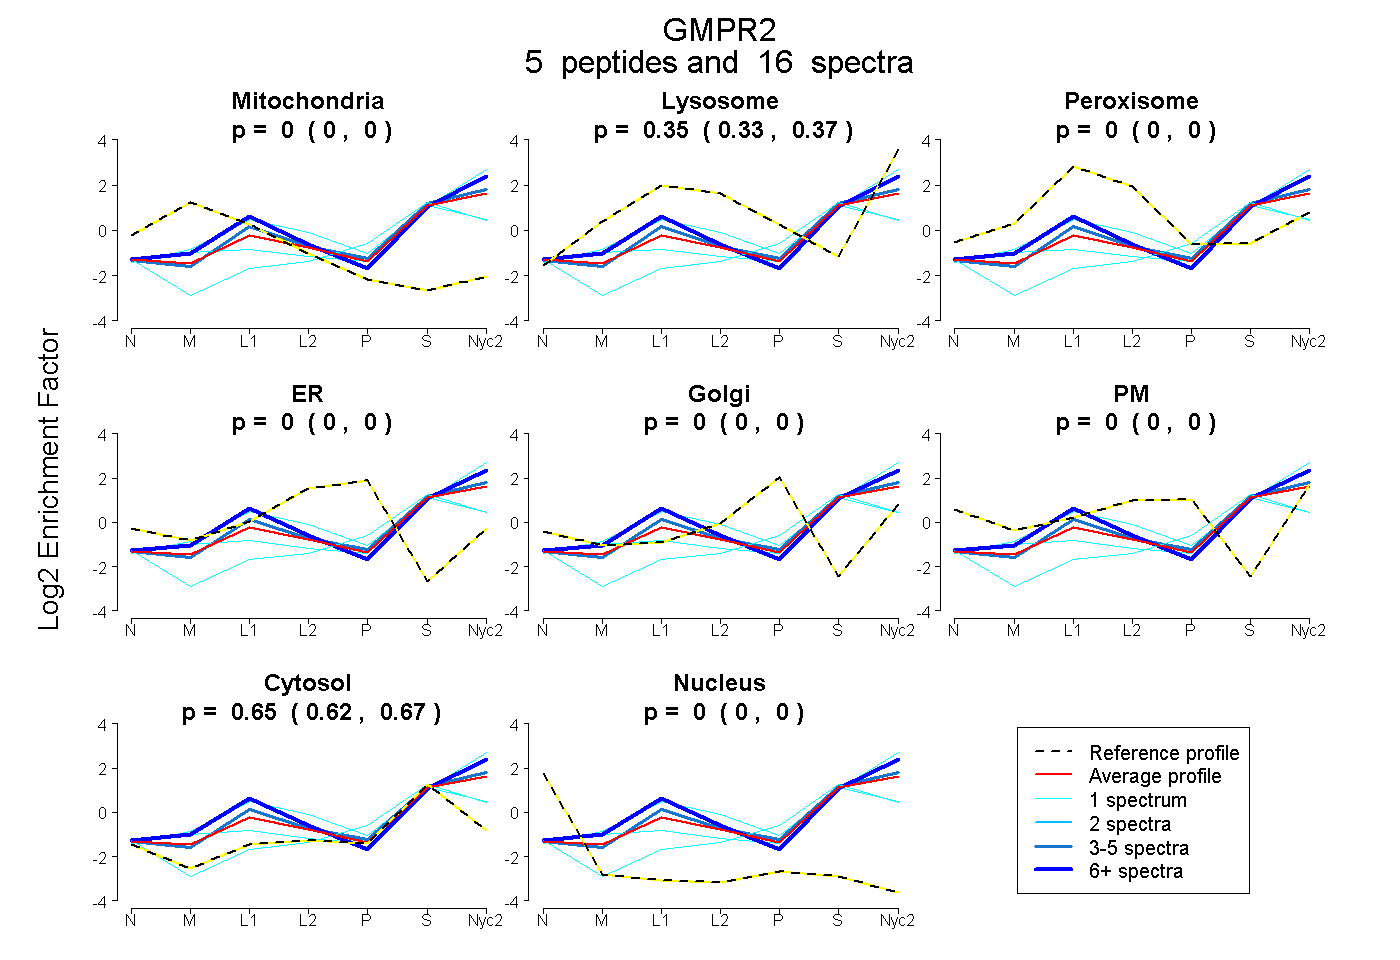
0.000 | 0.000
0.329 | 0.372
0.000 | 0.000
0.000 | 0.000
0.000 | 0.000
0.000 | 0.000
0.623 | 0.668
0.000 | 0.000
3peptides
spectra
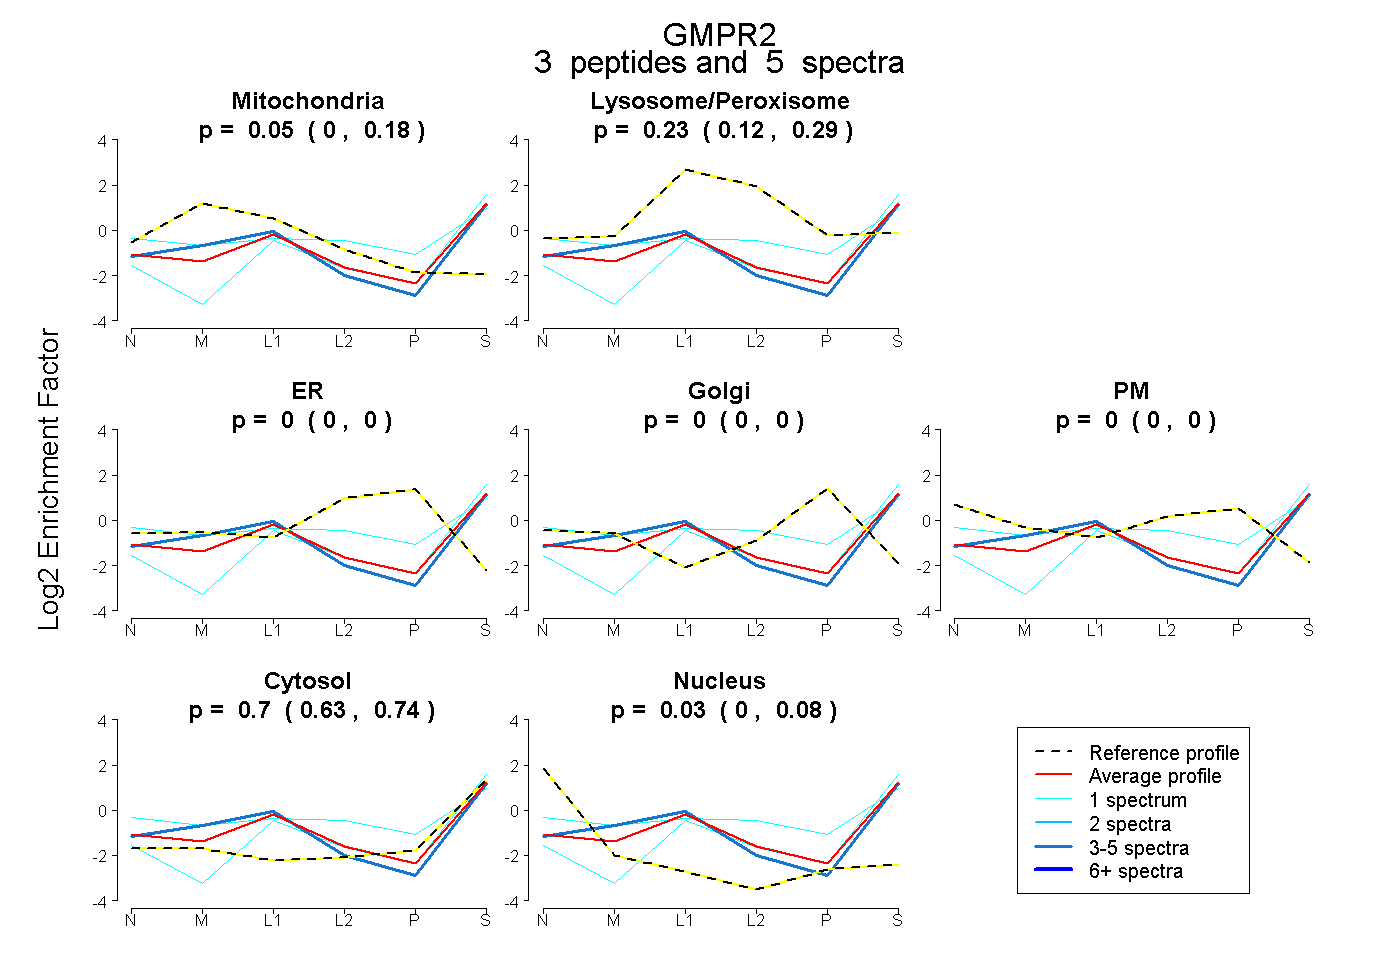
0.000 | 0.183
0.125 | 0.285
0.000 | 0.000
0.000 | 0.000
0.000 | 0.000
0.635 | 0.736
0.000 | 0.079
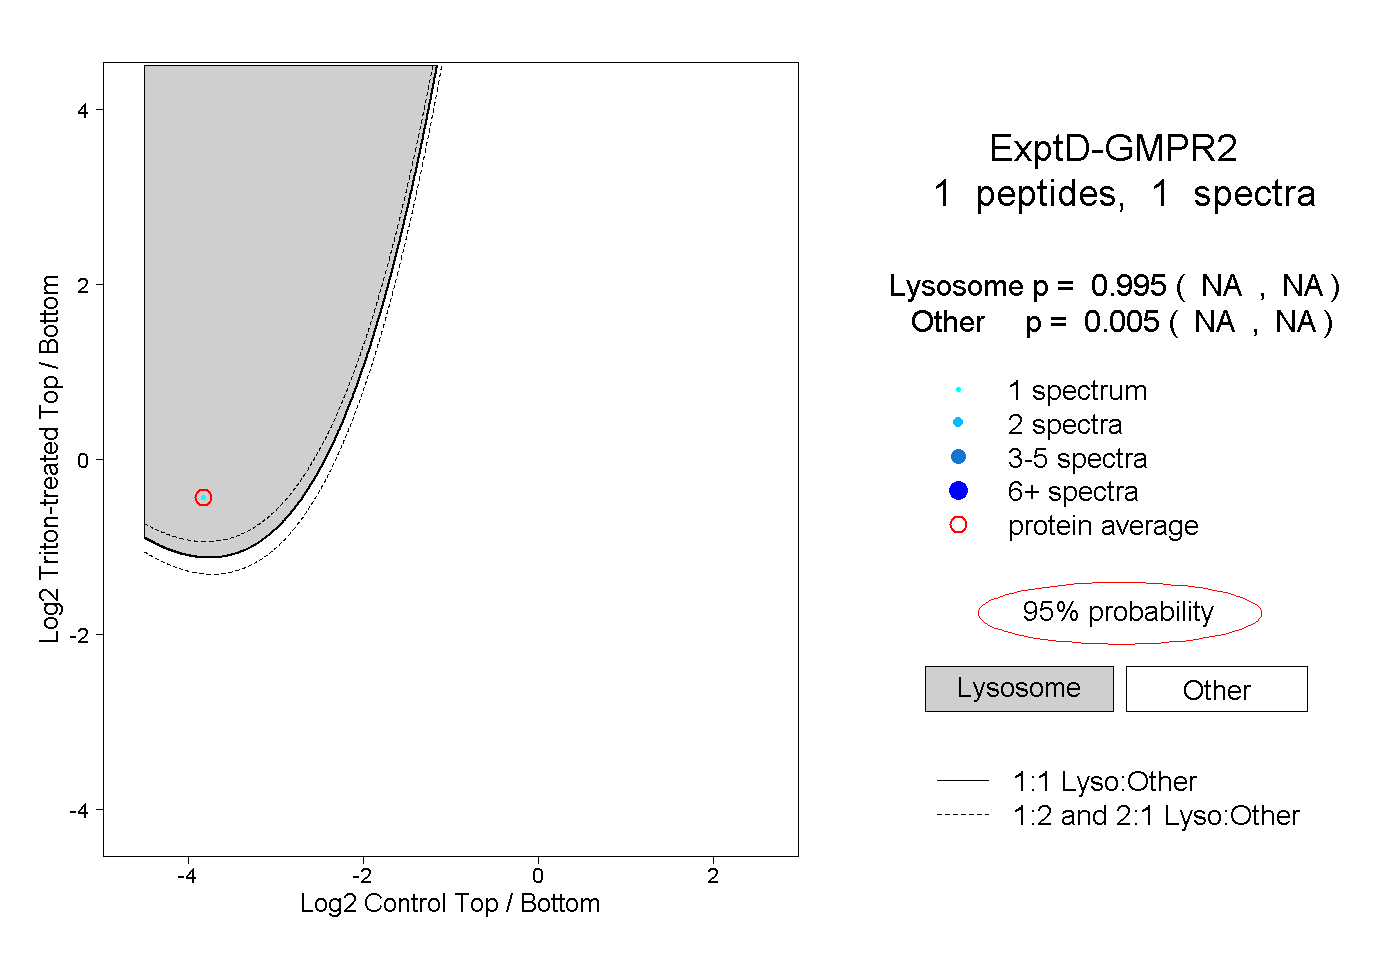
5peptides
spectra
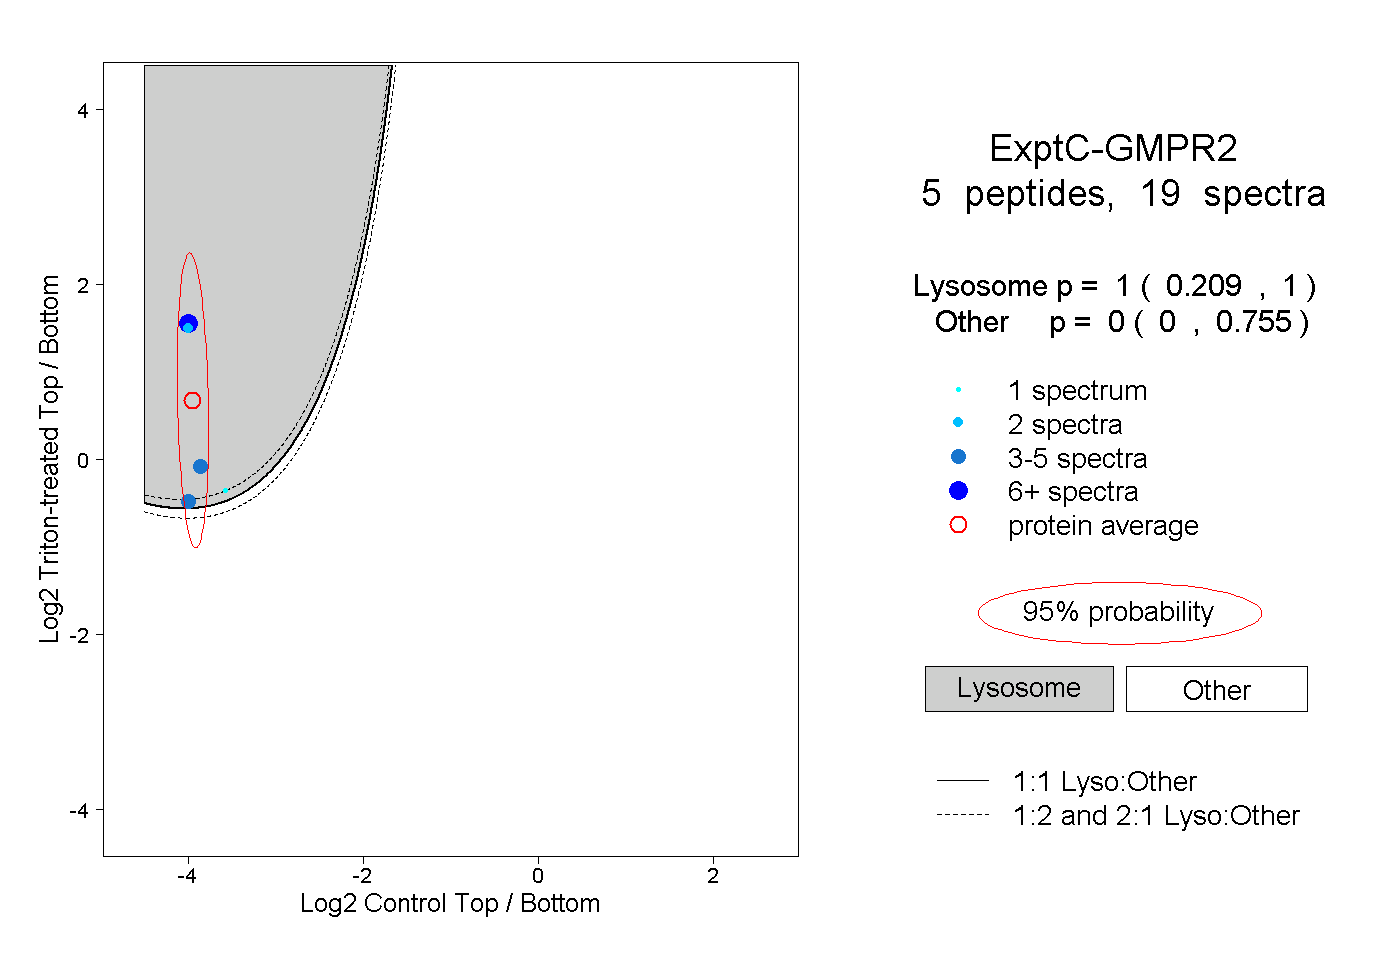
0.209 | 1.000
0.000 | 0.755