 5
5peptides
spectra
0.000 | 0.000
0.329 | 0.372
0.000 | 0.000
0.000 | 0.000
0.000 | 0.000
0.000 | 0.000
0.623 | 0.668
0.000 | 0.000
| Plot | Mito | Lyso | Perox | ER | Golgi | PM | Cytosol | Nucleus | |||||
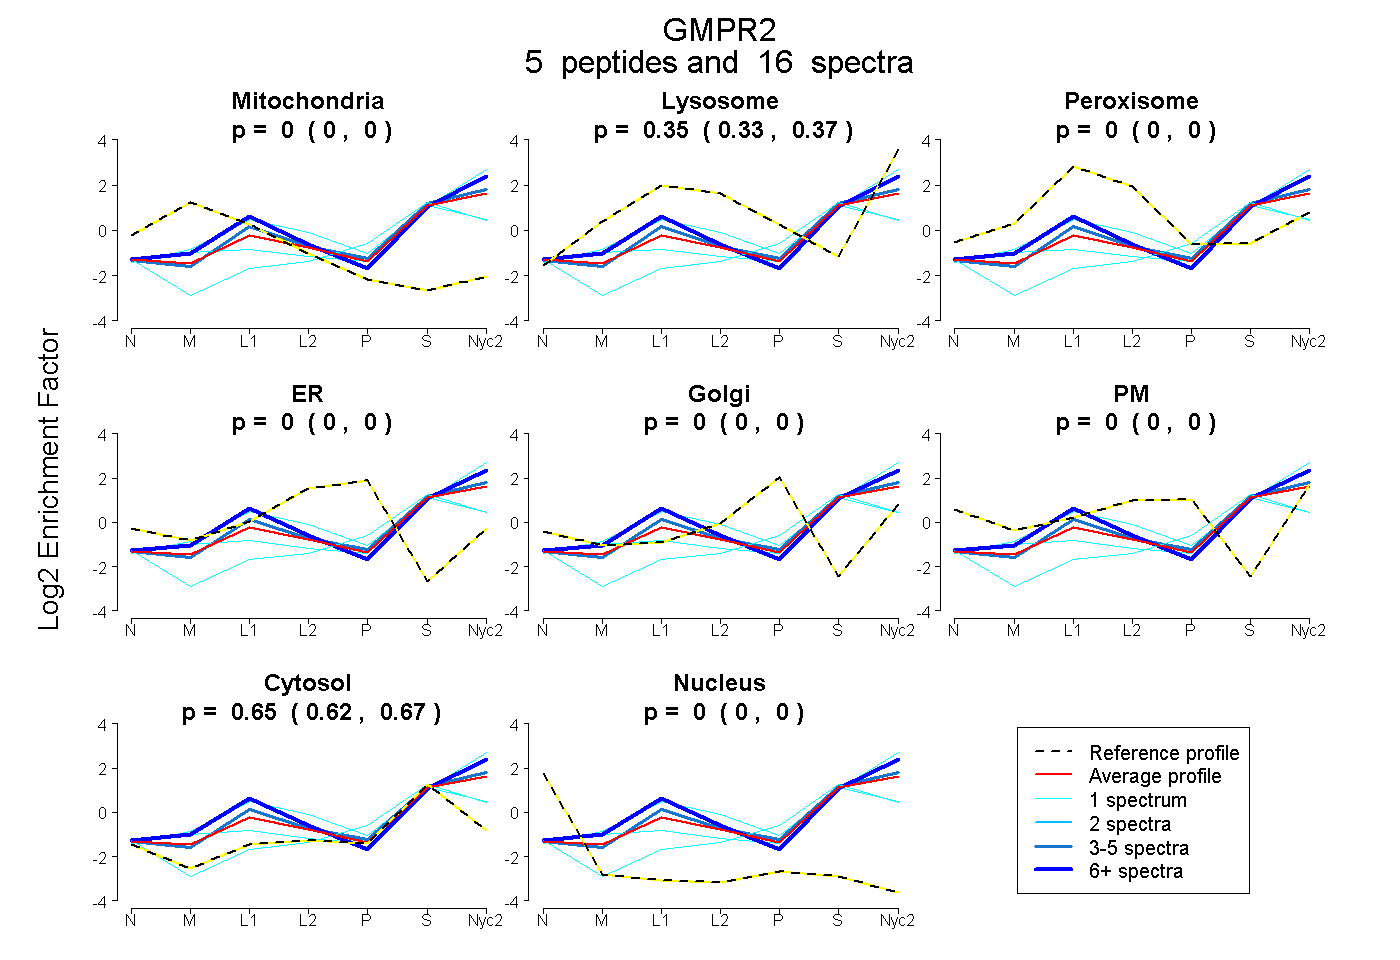
| Expt A |
5 peptides |
16 spectra |
|
0.000 0.000 | 0.000 |
0.352 0.329 | 0.372 |
0.000 0.000 | 0.000 |
0.000 0.000 | 0.000 |
0.000 0.000 | 0.000 |
0.000 0.000 | 0.000 |
0.648 0.623 | 0.668 |
0.000 0.000 | 0.000 |
| 1 spectrum, DVLLRPK | 0.000 | 0.558 | 0.000 | 0.000 | 0.000 | 0.000 | 0.442 | 0.000 | ||
| 1 spectrum, TGVGYPQLSAVMECADAAHGLK | 0.050 | 0.212 | 0.000 | 0.000 | 0.000 | 0.000 | 0.738 | 0.000 | ||
| 5 spectra, FSLFTAIHK | 0.000 | 0.385 | 0.000 | 0.000 | 0.000 | 0.000 | 0.615 | 0.000 | ||
| 8 spectra, VGIGPGSVCTTR | 0.000 | 0.486 | 0.000 | 0.000 | 0.000 | 0.000 | 0.514 | 0.000 | ||
| 1 spectrum, YSGGVAEYR | 0.000 | 0.025 | 0.000 | 0.000 | 0.105 | 0.000 | 0.870 | 0.000 |
| Plot | Mito | Lyso or Perox | ER | Golgi | PM | Cytosol | Nucleus | ||||||
| Expt B |
3 peptides |
5 spectra |
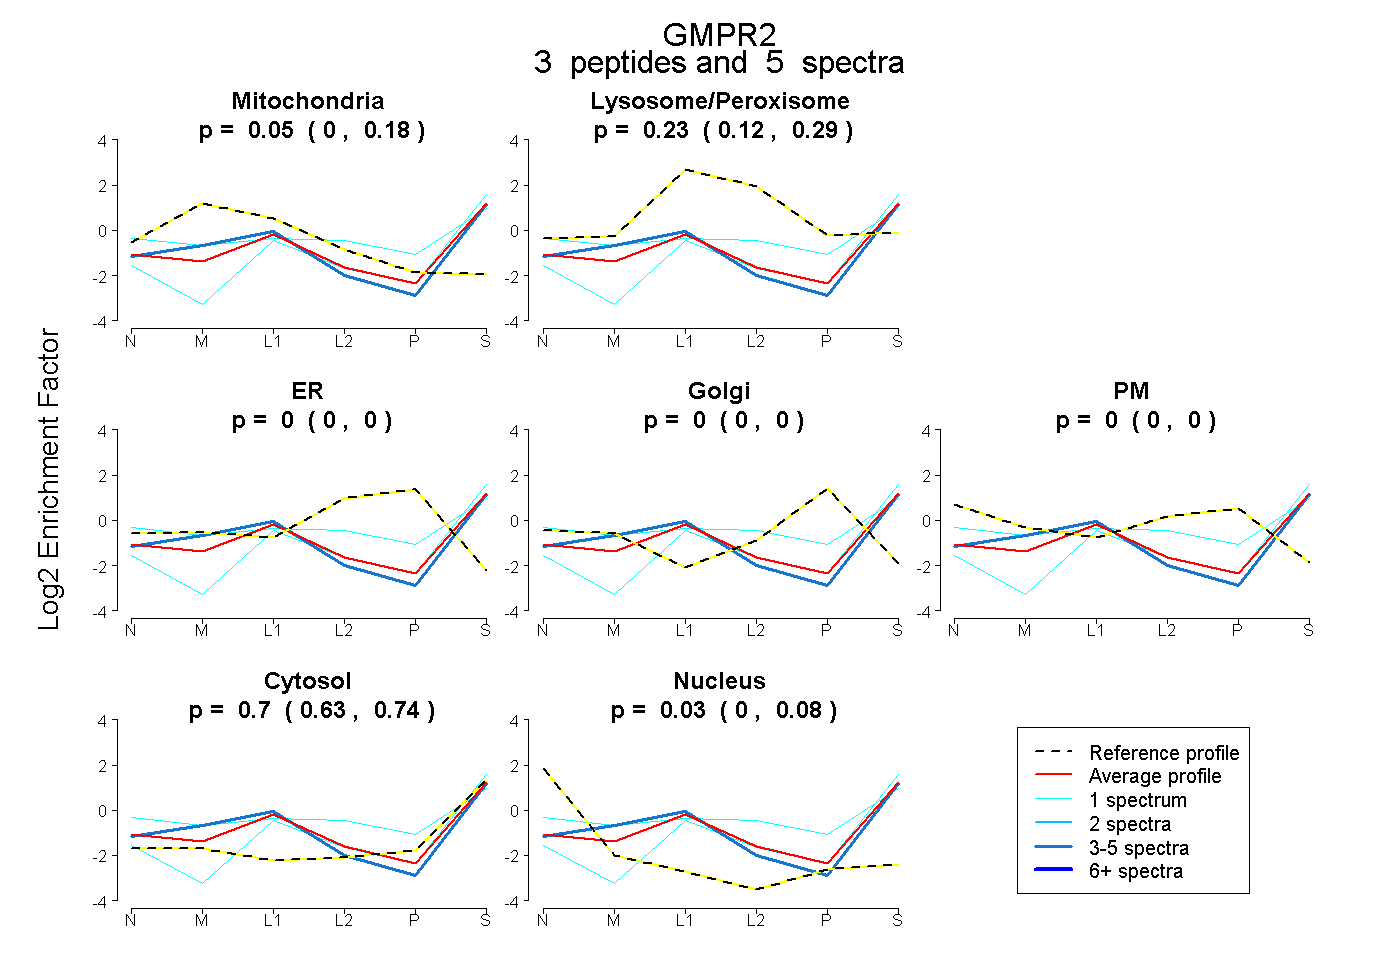 |
0.050 0.000 | 0.183 |
0.226 0.125 | 0.285 |
0.000 0.000 | 0.000 |
0.000 0.000 | 0.000 |
0.000 0.000 | 0.000 |
0.695 0.635 | 0.736 |
0.030 0.000 | 0.079 |
|||
| Plot | Lyso | Other | |||||||||||
| Expt C |
5 peptides |
19 spectra |
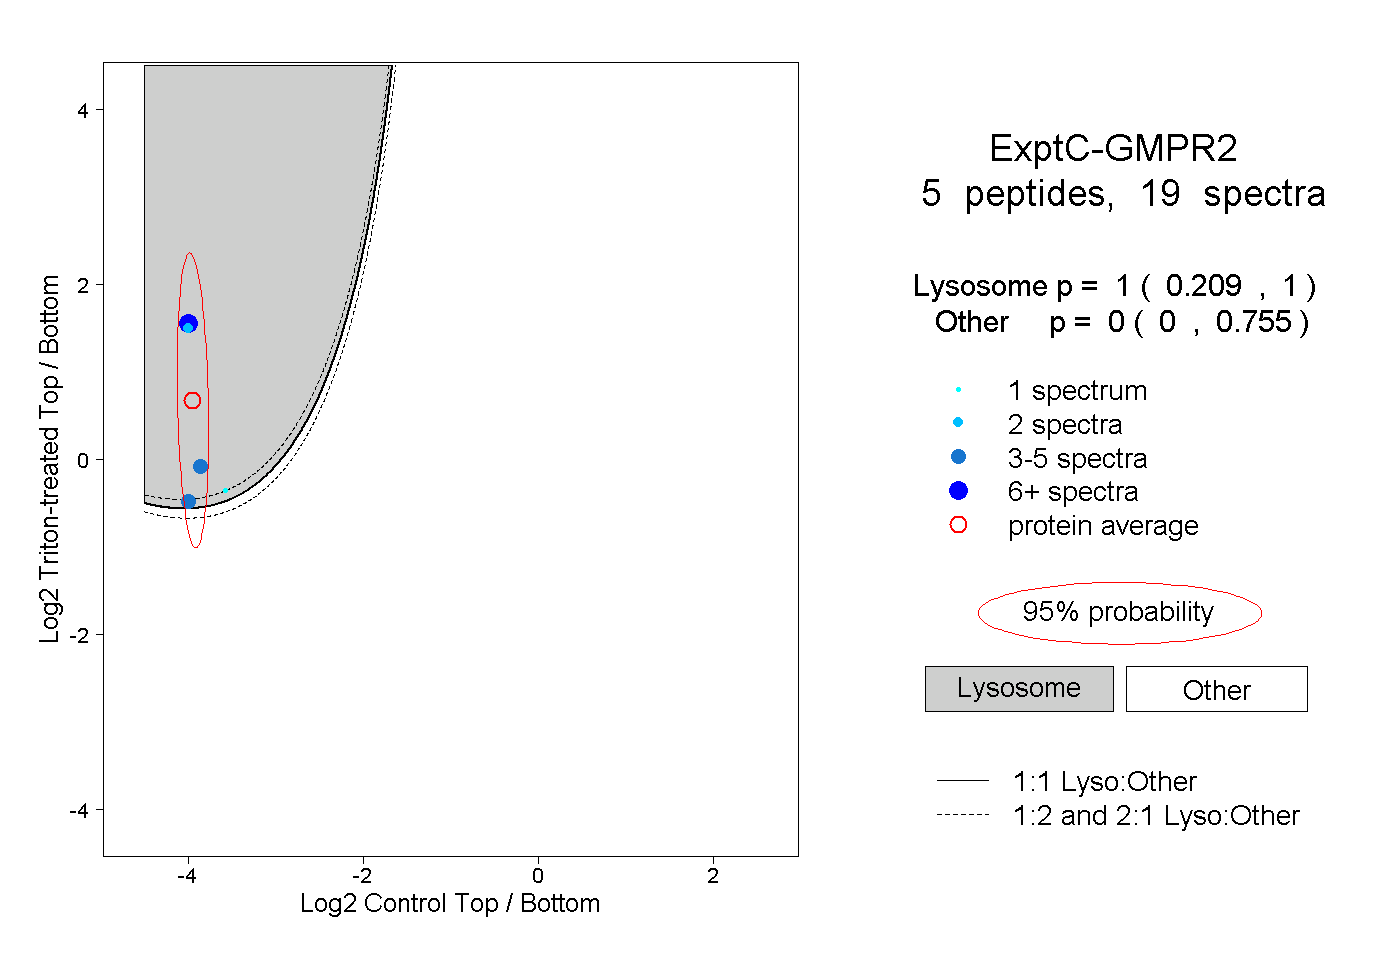 |
1.000 0.209 | 1.000 |
0.000 0.000 | 0.755 |
||||||||
| Plot | Lyso | Other | |||||||||||
| Expt D |
1 peptide |
1 spectrum |
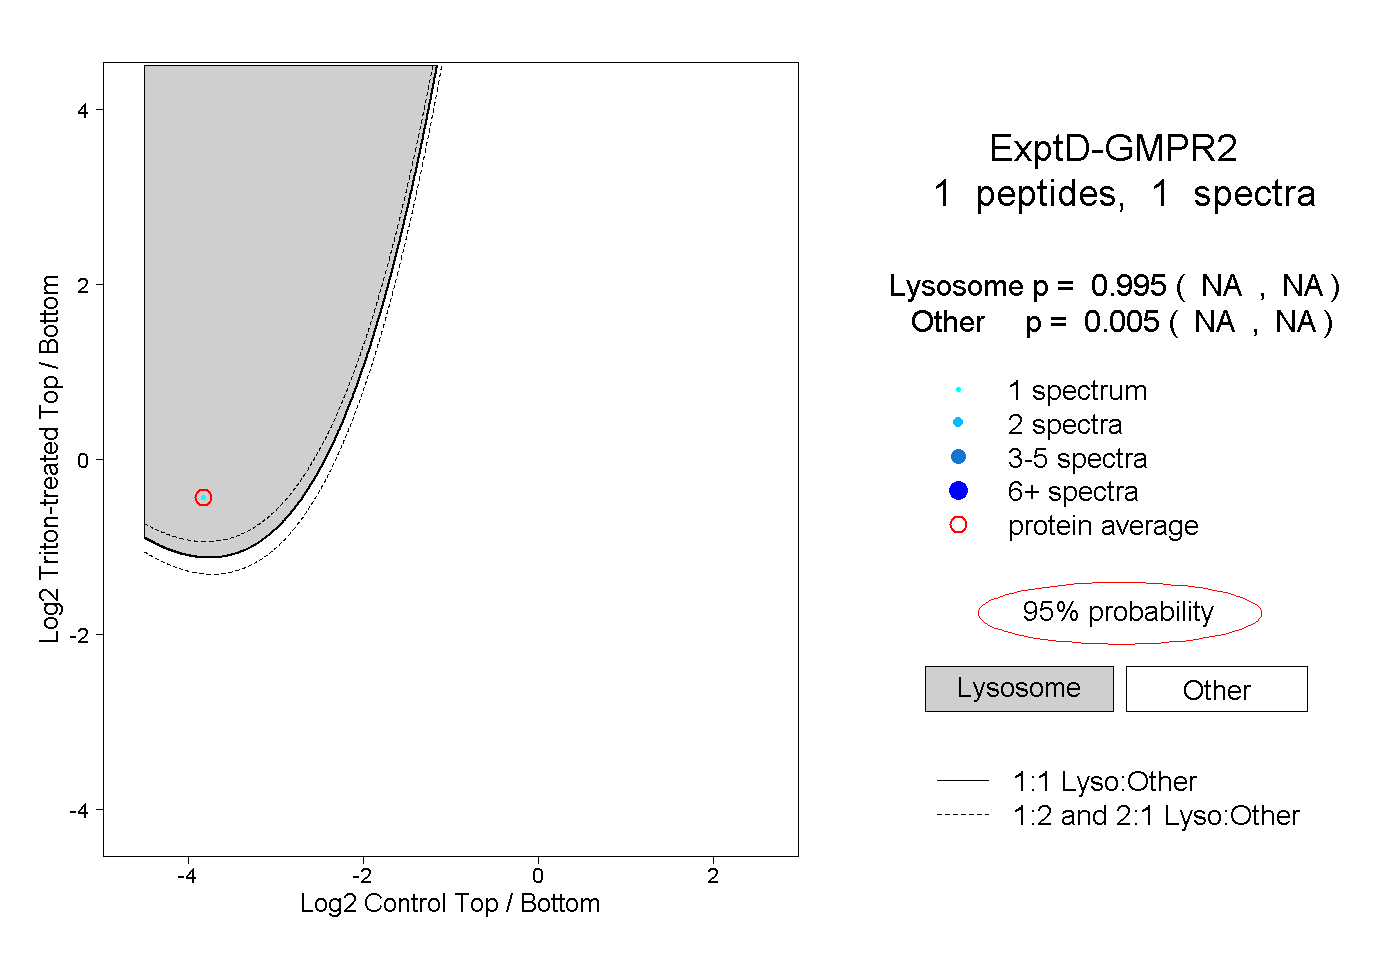 |
0.995 NA | NA |
0.005 NA | NA |