 5
5peptides
spectra
0.000 | 0.000
0.000 | 0.000
0.000 | 0.000
0.070 | 0.248
0.084 | 0.286
0.000 | 0.000
0.123 | 0.146
0.478 | 0.522
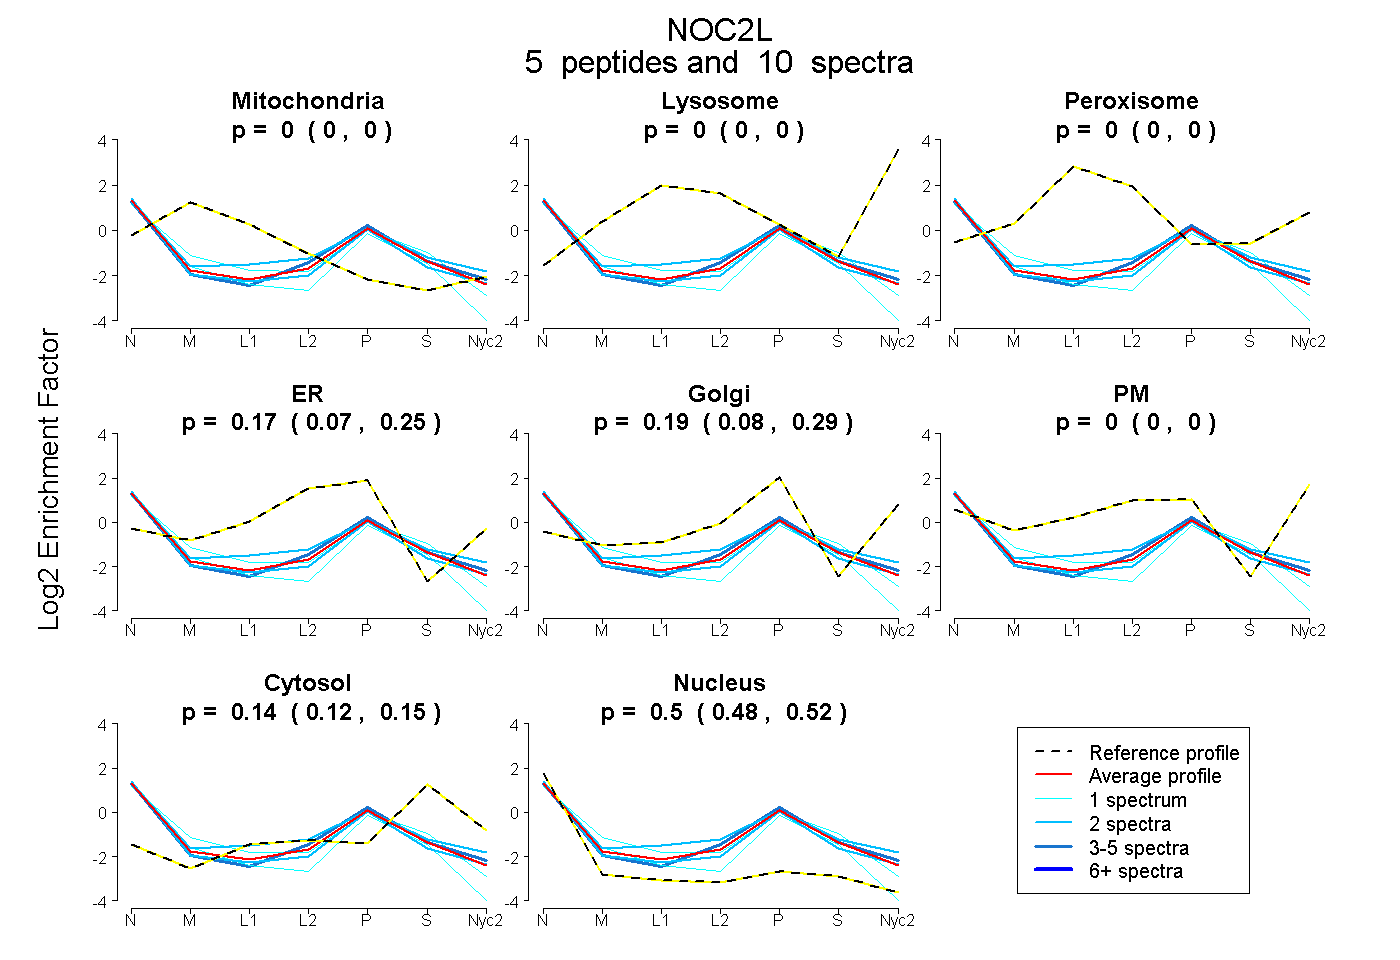
| Plot | Mito | Lyso | Perox | ER | Golgi | PM | Cytosol | Nucleus | |||||
| Expt A |
5 peptides |
10 spectra |
|
0.000 0.000 | 0.000 |
0.000 0.000 | 0.000 |
0.000 0.000 | 0.000 |
0.167 0.070 | 0.248 |
0.195 0.084 | 0.286 |
0.000 0.000 | 0.000 |
0.136 0.123 | 0.146 |
0.503 0.478 | 0.522 |
| 2 spectra, VQENAEHIR | 0.000 | 0.000 | 0.000 | 0.259 | 0.080 | 0.074 | 0.186 | 0.401 | ||
| 2 spectra, QLAVHLR | 0.000 | 0.000 | 0.000 | 0.028 | 0.336 | 0.000 | 0.080 | 0.556 | ||
| 1 spectrum, LSSTNLQEK | 0.000 | 0.000 | 0.000 | 0.201 | 0.000 | 0.000 | 0.094 | 0.704 | ||
| 1 spectrum, LEDLNFPEIK | 0.055 | 0.000 | 0.000 | 0.280 | 0.000 | 0.000 | 0.203 | 0.462 | ||
| 4 spectra, LFHEVVQAFR | 0.000 | 0.000 | 0.000 | 0.119 | 0.269 | 0.000 | 0.130 | 0.482 |