 1
1peptide
spectra
NA | NA
NA | NA
NA | NA
NA | NA
NA | NA
NA | NA
NA | NA
NA | NA
2peptides
spectra
0.000 | 0.000
1.000 | 1.000
| Plot | Mito | Lyso | Perox | ER | Golgi | PM | Cytosol | Nucleus | |||||
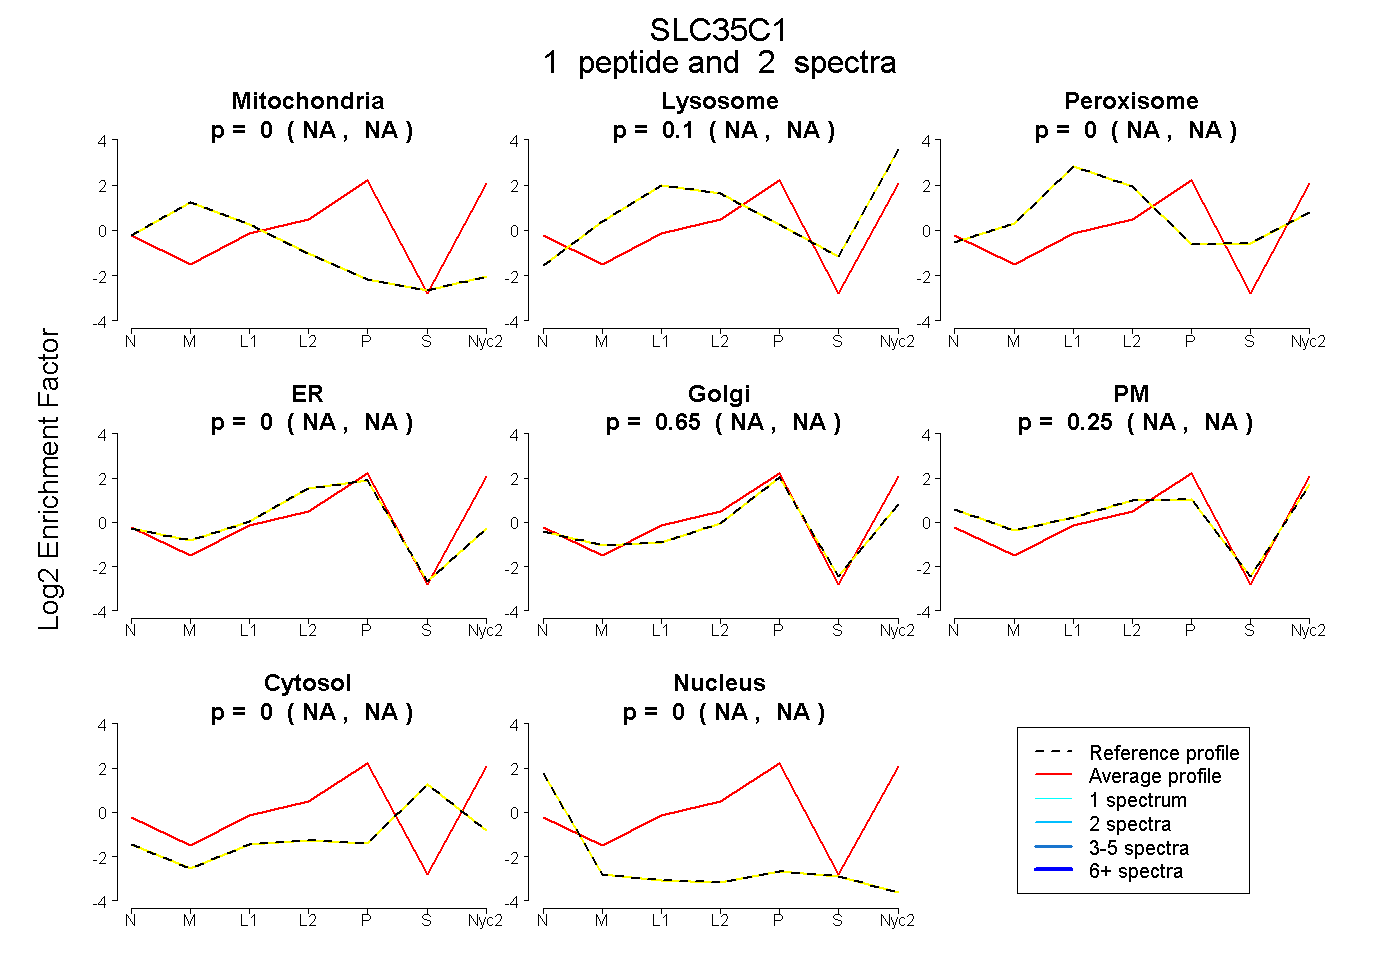
| Expt A |
1 peptide |
2 spectra |
|
0.000 NA | NA |
0.099 NA | NA |
0.000 NA | NA |
0.000 NA | NA |
0.647 NA | NA |
0.254 NA | NA |
0.000 NA | NA |
0.000 NA | NA |
||
| Plot | Lyso | Other | |||||||||||
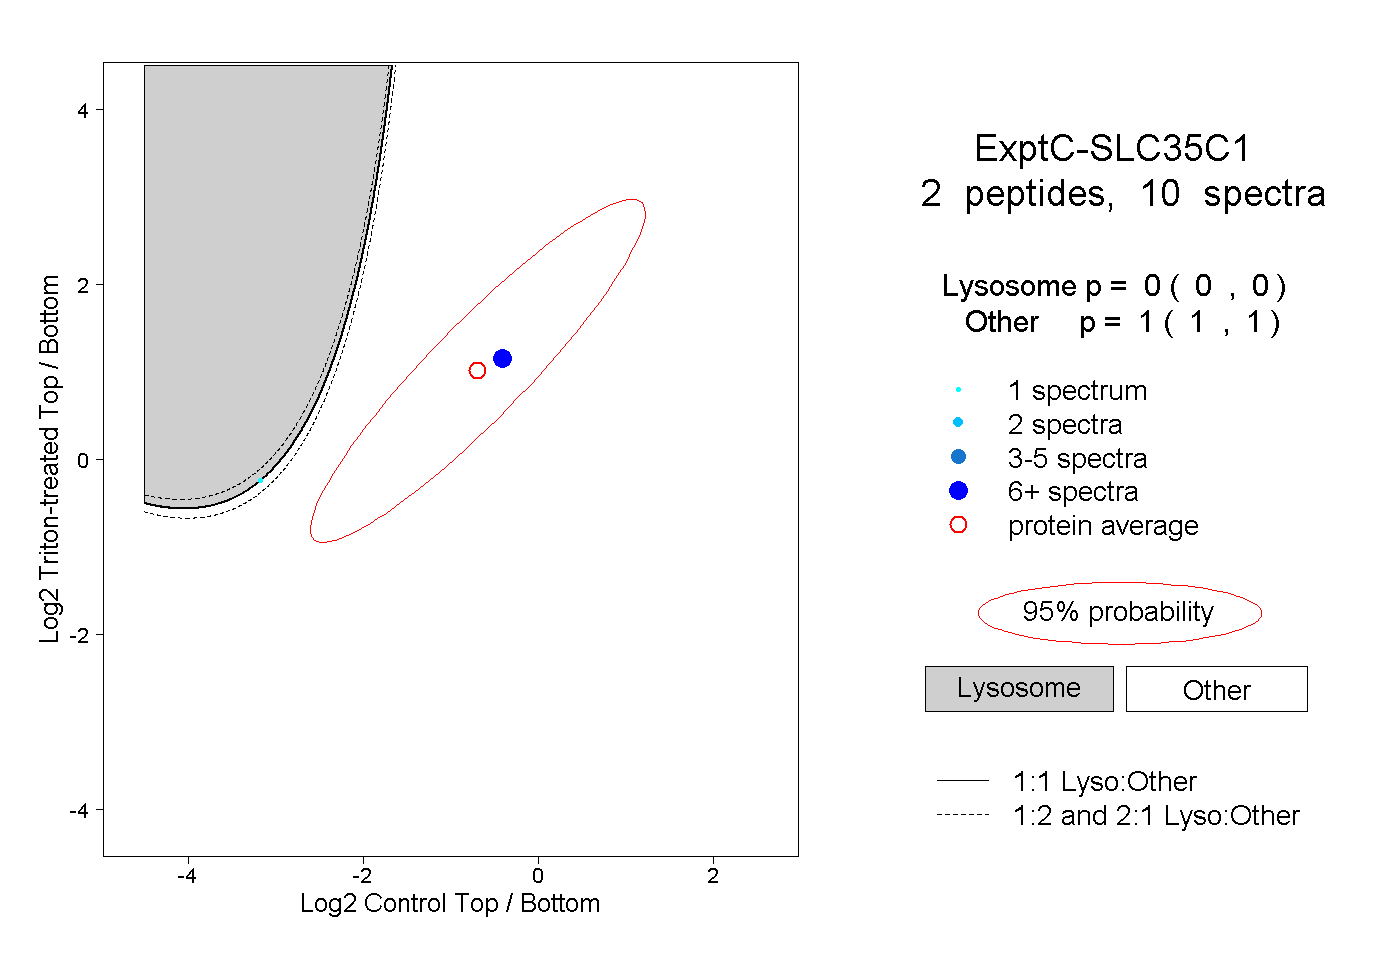
| Expt C |
2 peptides |
10 spectra |
|
0.000 0.000 | 0.000 |
1.000 1.000 | 1.000 |
| 1 spectrum, FTSPLTHNVSGTAK | 0.512 | 0.488 | ||||||||
| 9 spectra, TQEDPSSK | 0.000 | 1.000 |