 2
2peptides
spectra
0.000 | 0.000
0.000 | 0.000
0.157 | 0.251
0.000 | 0.098
0.000 | 0.074
0.205 | 0.378
0.410 | 0.465
0.000 | 0.000
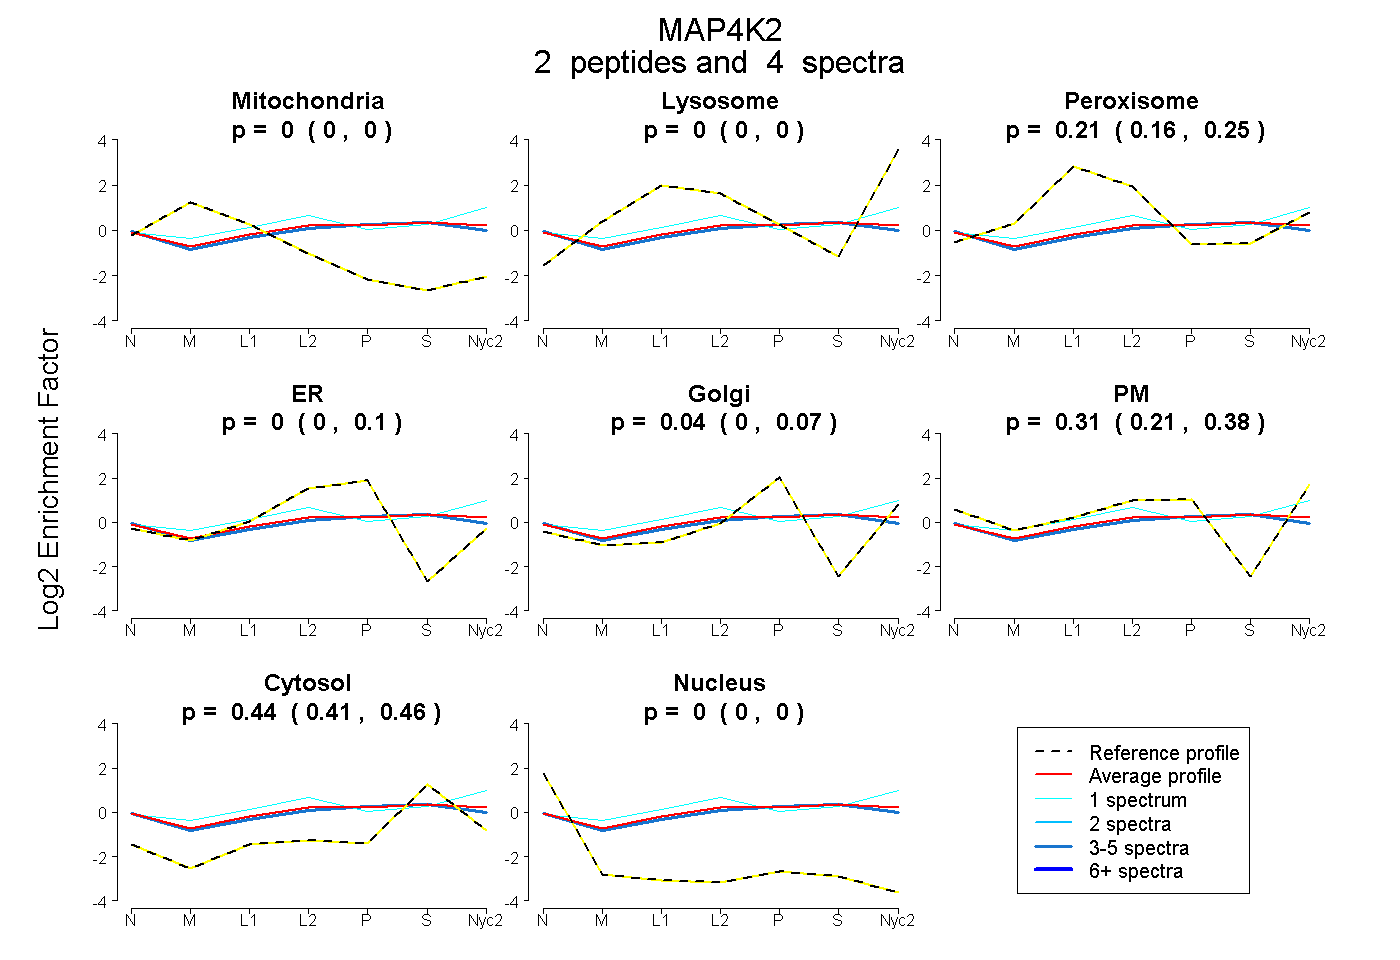
| Plot | Mito | Lyso | Perox | ER | Golgi | PM | Cytosol | Nucleus | |||||
| Expt A |
2 peptides |
4 spectra |
|
0.000 0.000 | 0.000 |
0.000 0.000 | 0.000 |
0.213 0.157 | 0.251 |
0.000 0.000 | 0.098 |
0.035 0.000 | 0.074 |
0.313 0.205 | 0.378 |
0.439 0.410 | 0.465 |
0.000 0.000 | 0.000 |
| 1 spectrum, VLGAHR | 0.000 | 0.116 | 0.238 | 0.000 | 0.000 | 0.301 | 0.346 | 0.000 | ||
| 3 spectra, LQHQAPLSIPTNR | 0.000 | 0.000 | 0.173 | 0.073 | 0.033 | 0.249 | 0.471 | 0.000 |
| Plot | Lyso | Other | |||||||||||
| Expt C |
1 peptide |
1 spectrum |
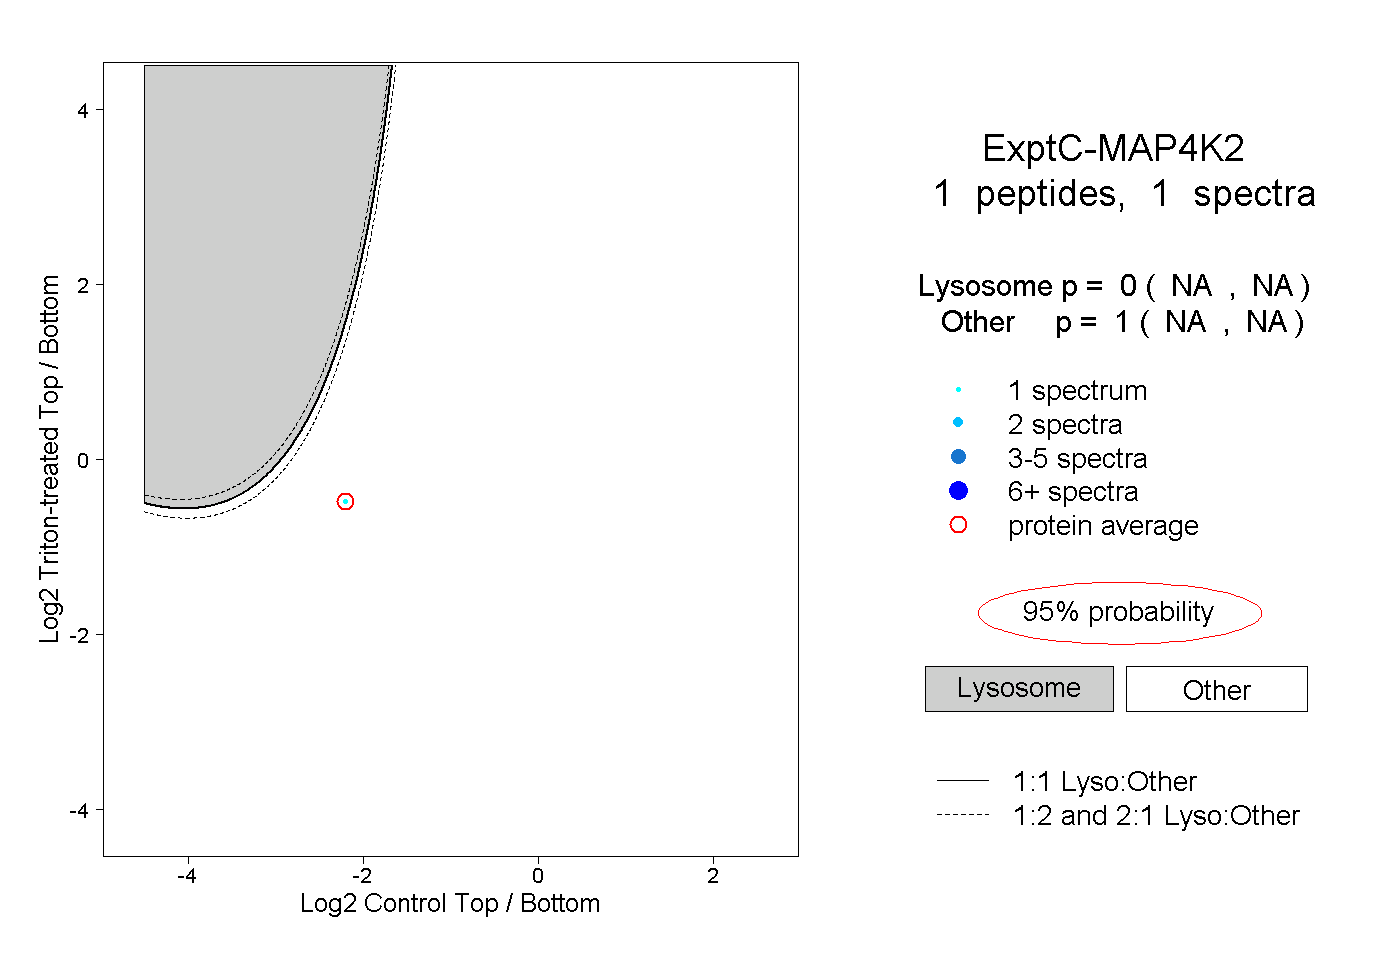 |
0.000 NA | NA |
1.000 NA | NA |