 25
25peptides
spectra
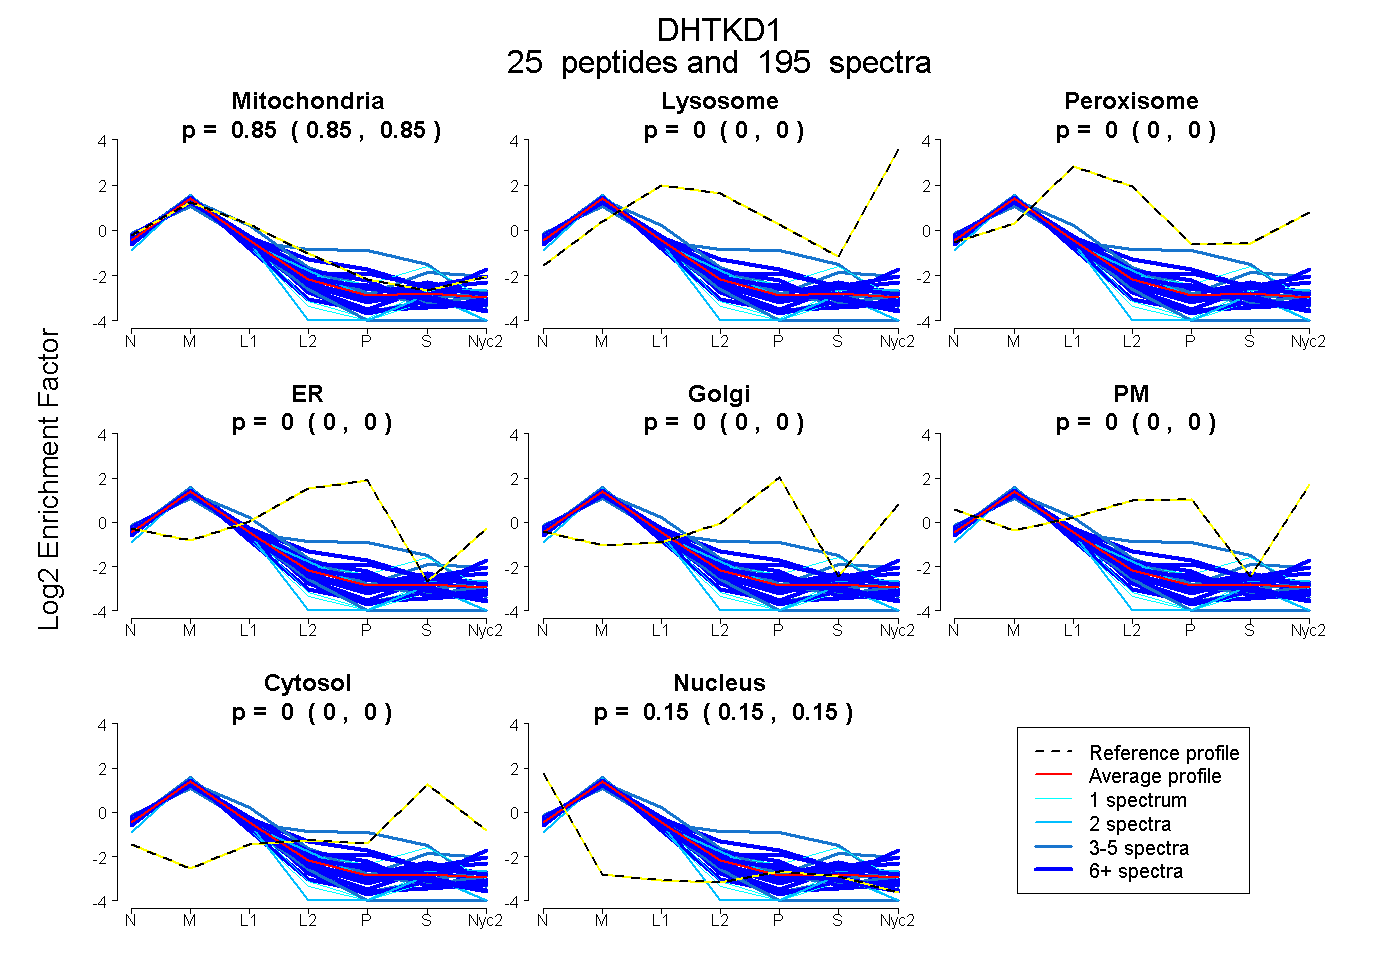
0.851 | 0.854
0.000 | 0.000
0.000 | 0.000
0.000 | 0.000
0.000 | 0.000
0.000 | 0.000
0.000 | 0.000
0.146 | 0.149
19peptides
spectra
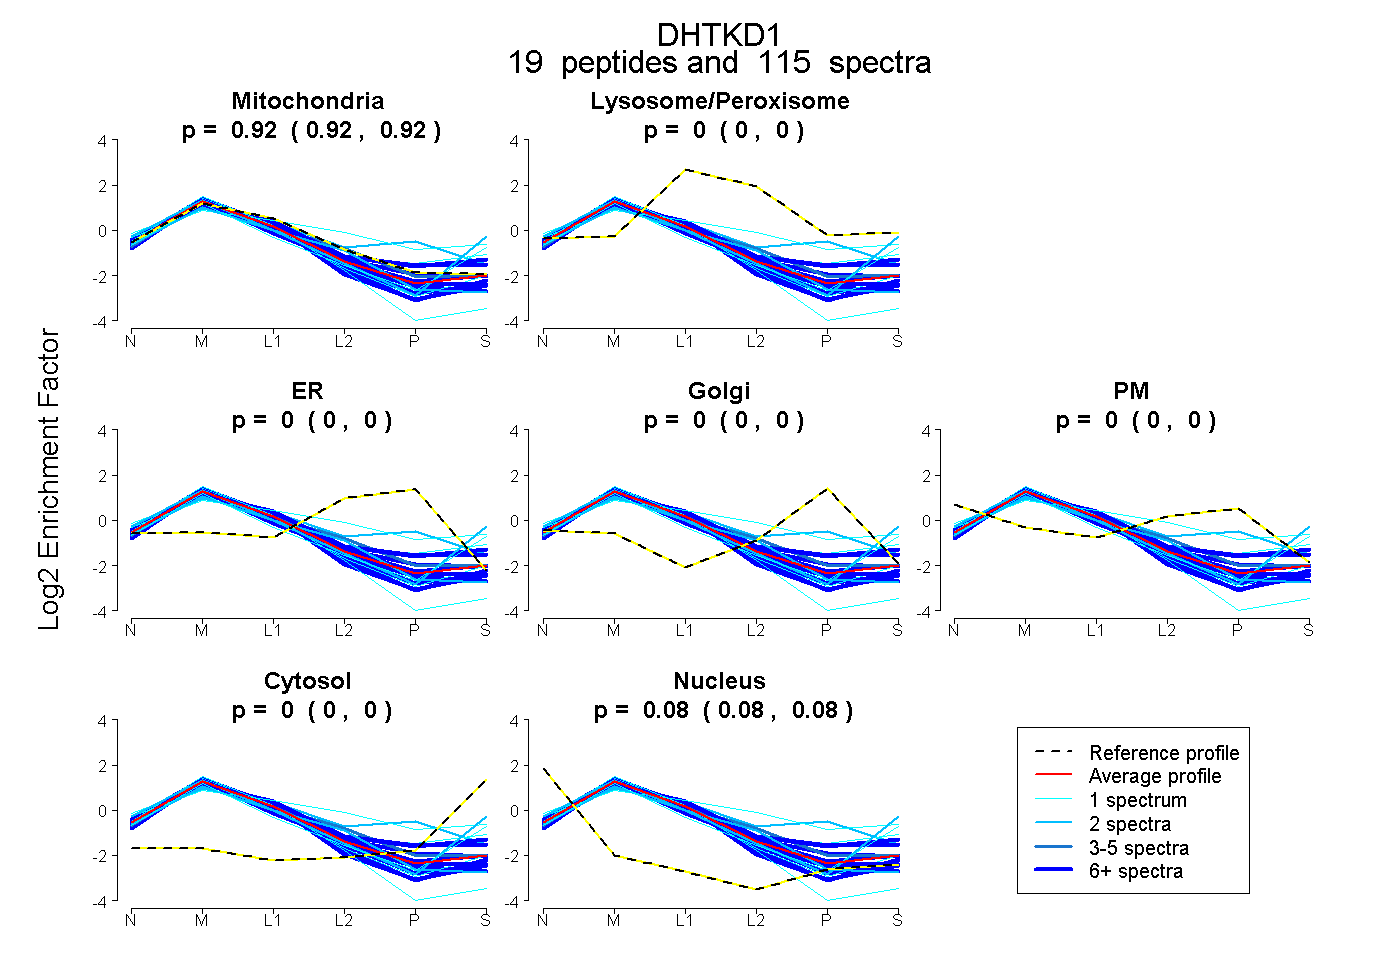
0.918 | 0.922
0.000 | 0.000
0.000 | 0.000
0.000 | 0.000
0.000 | 0.000
0.000 | 0.001
0.078 | 0.081
25peptides
spectra
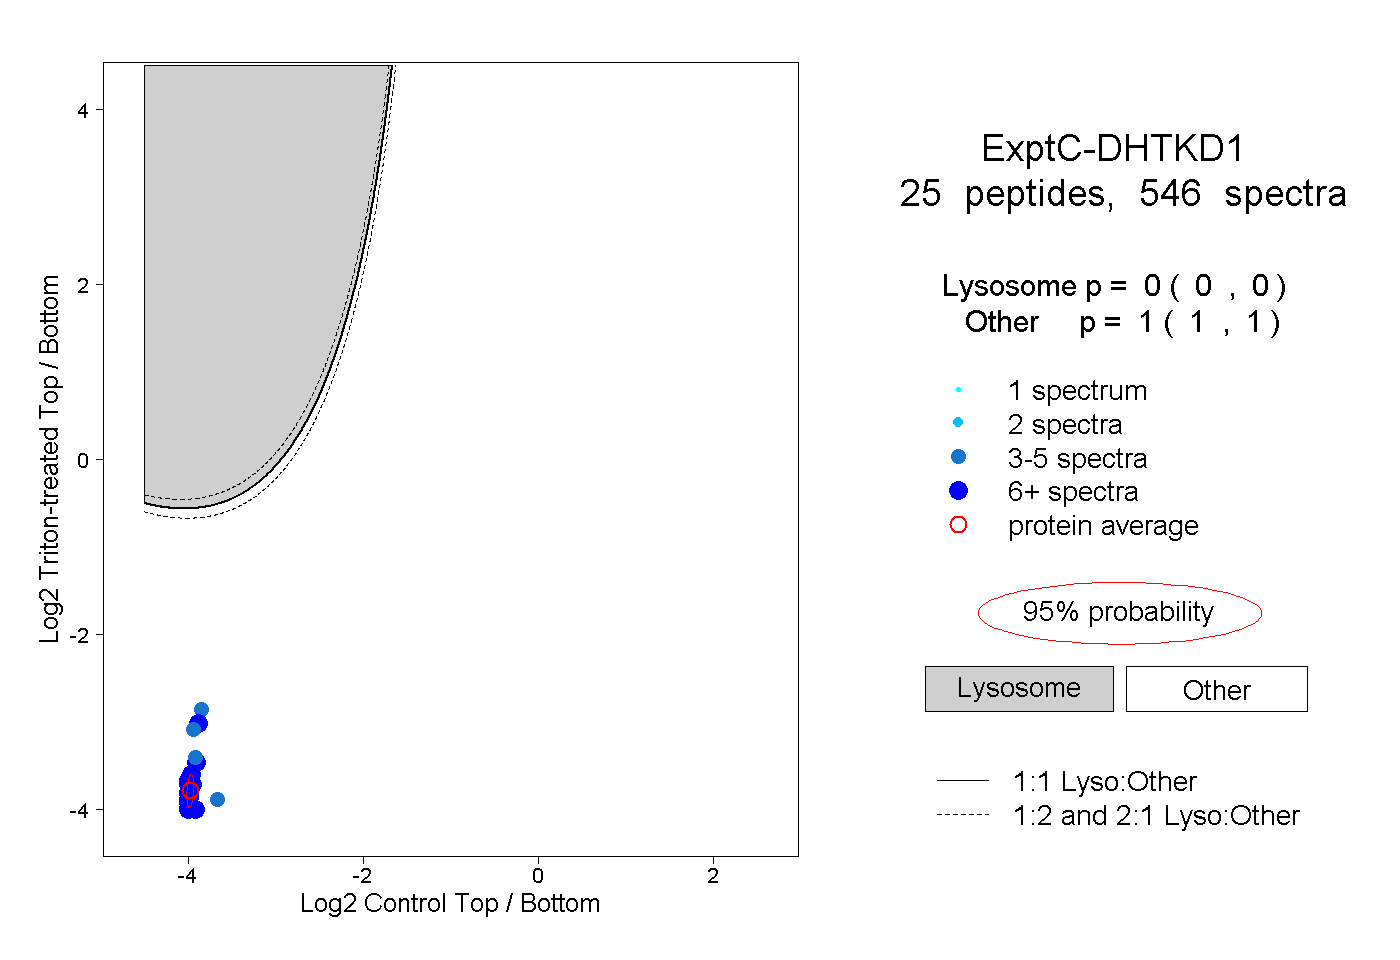
0.000 | 0.000
1.000 | 1.000
11peptides
spectra
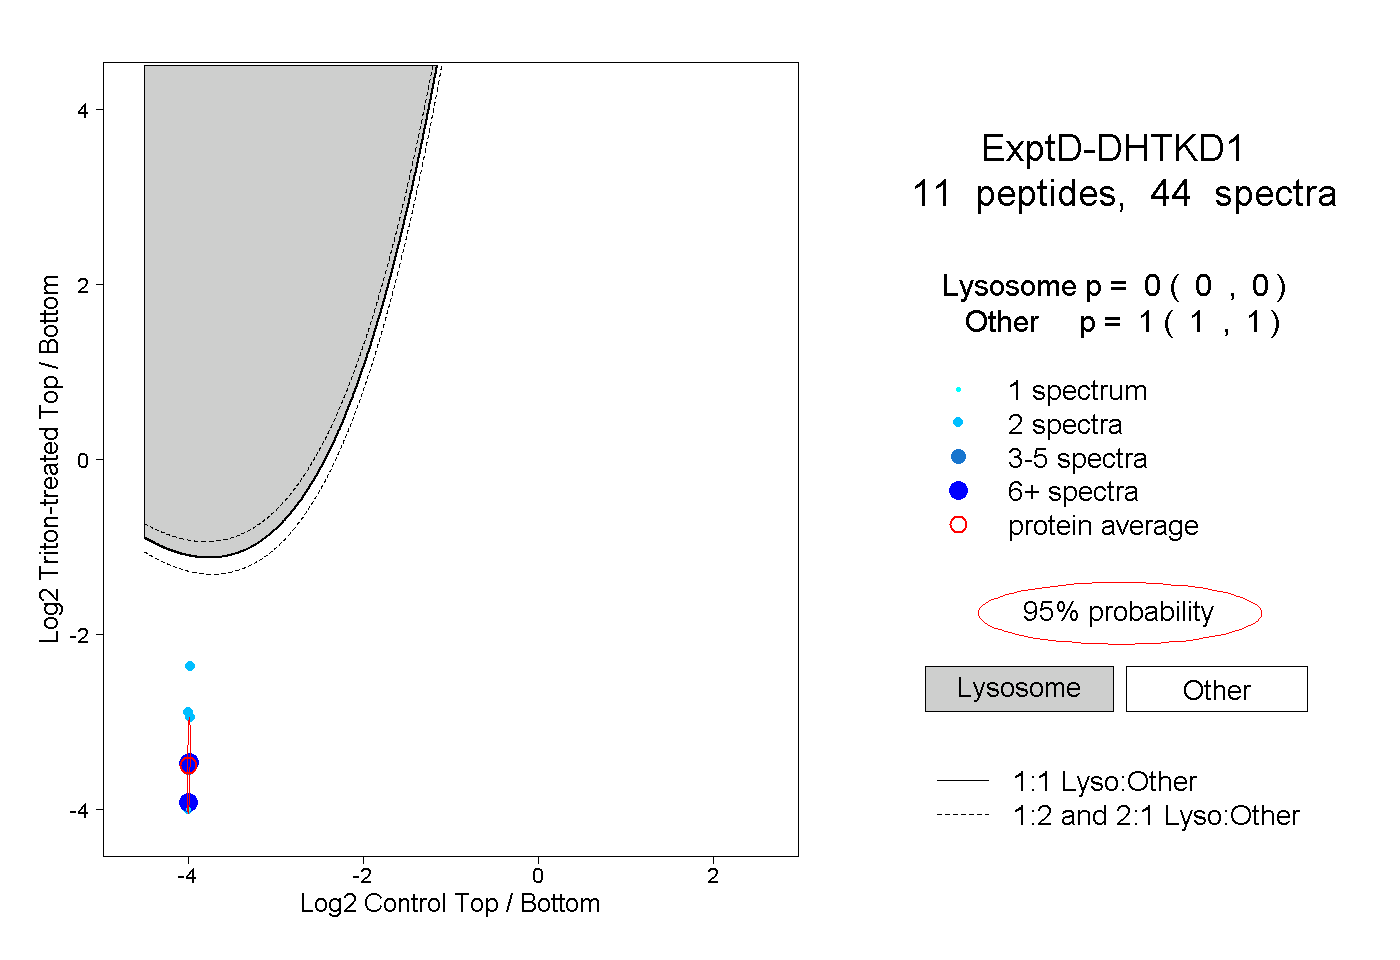
0.000 | 0.000
1.000 | 1.000