 3
3peptides
spectra
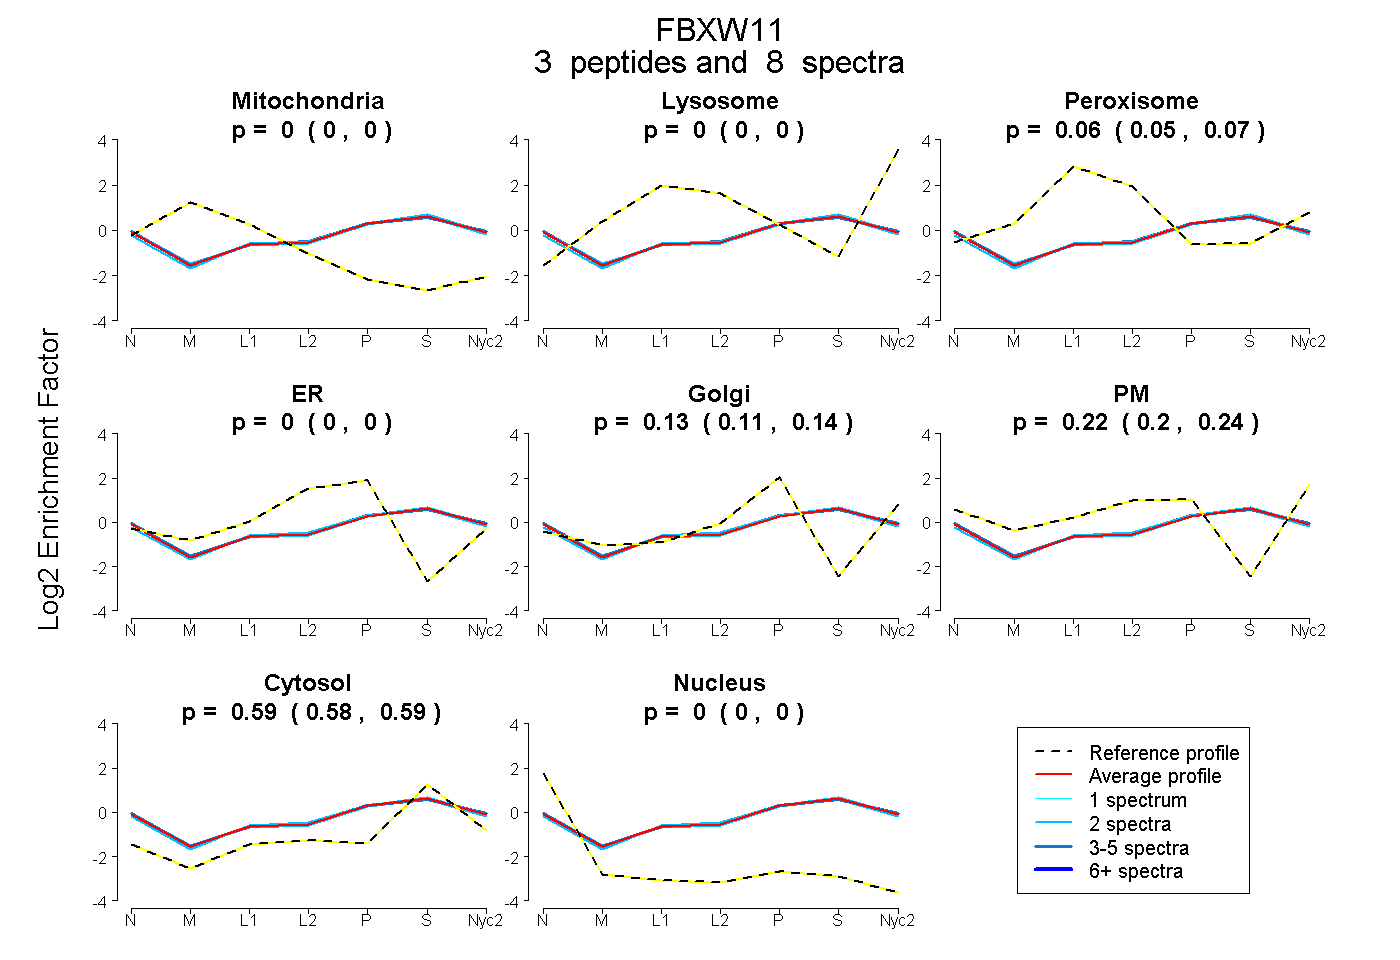
0.000 | 0.000
0.000 | 0.000
0.054 | 0.070
0.000 | 0.000
0.111 | 0.140
0.202 | 0.240
0.584 | 0.592
0.000 | 0.000
1peptide
spectra
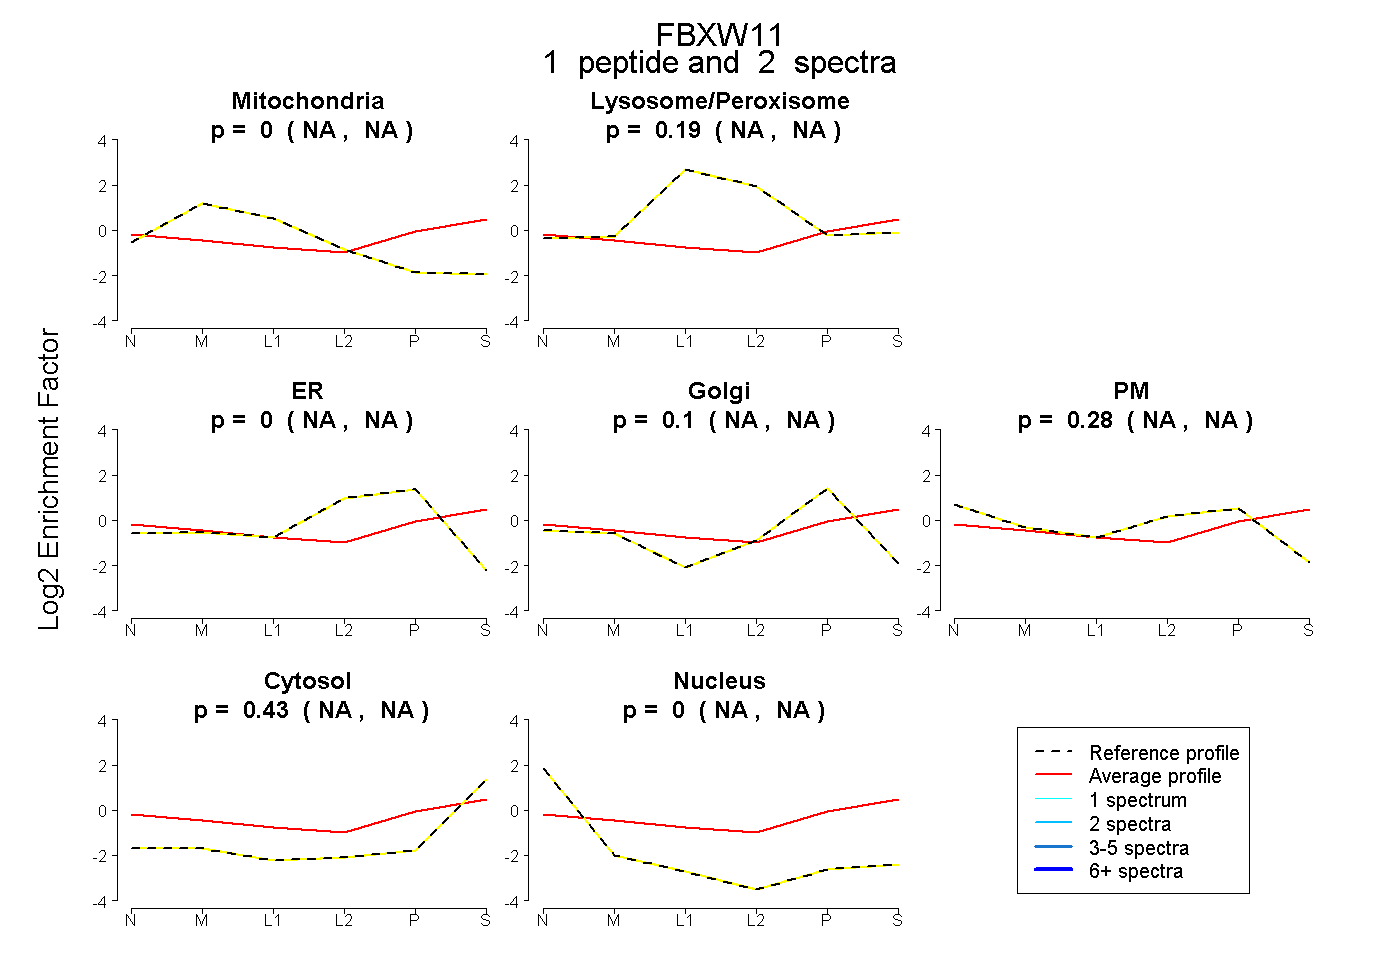
NA | NA
NA | NA
NA | NA
NA | NA
NA | NA
NA | NA
NA | NA
3peptides
spectra
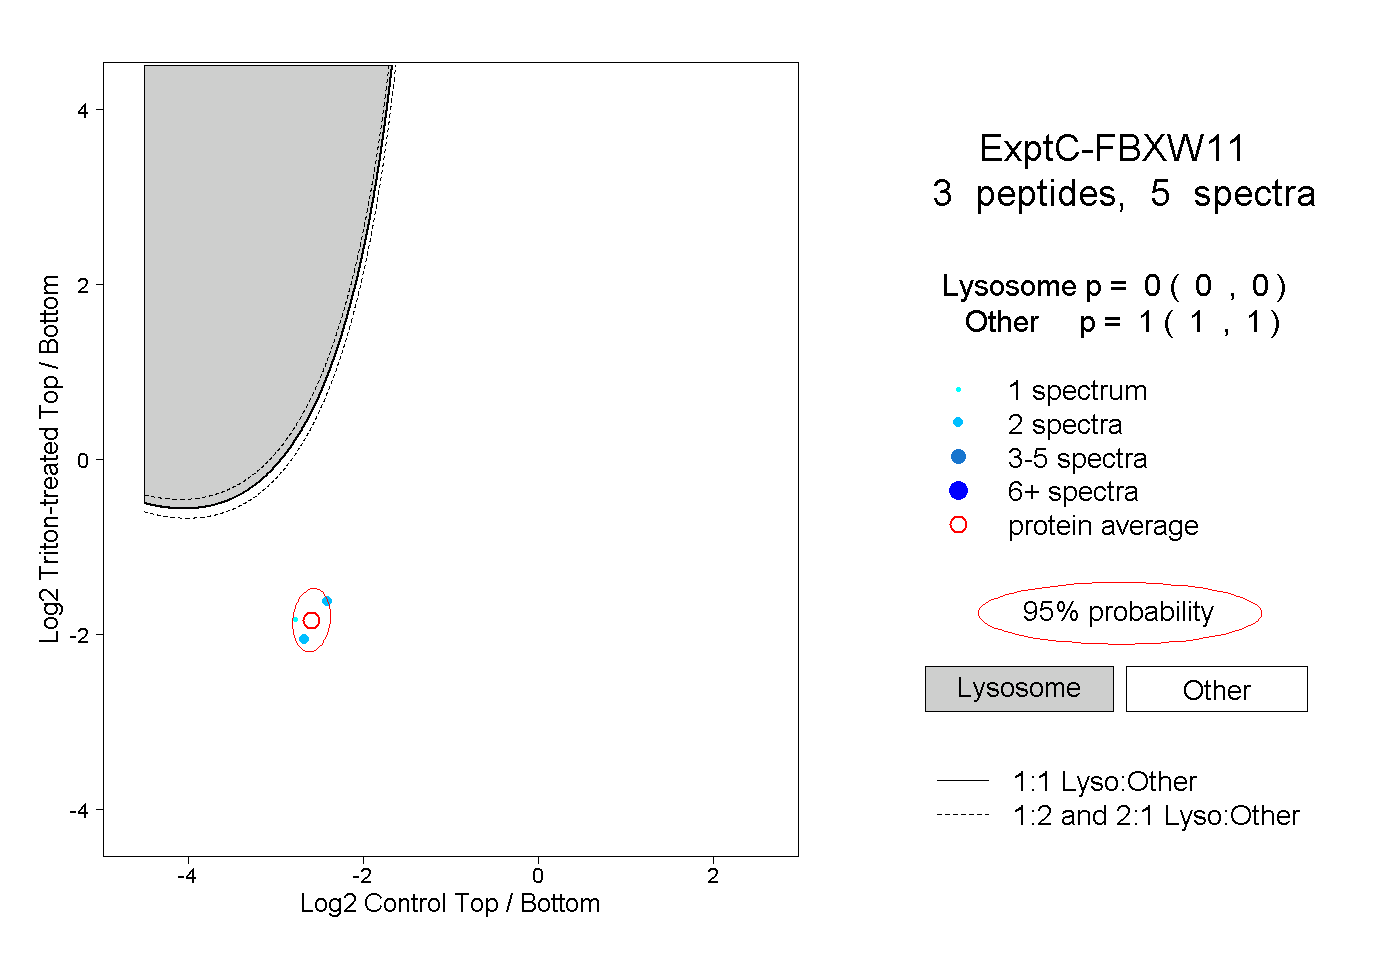
0.000 | 0.000
1.000 | 1.000