 4
4peptides
spectra
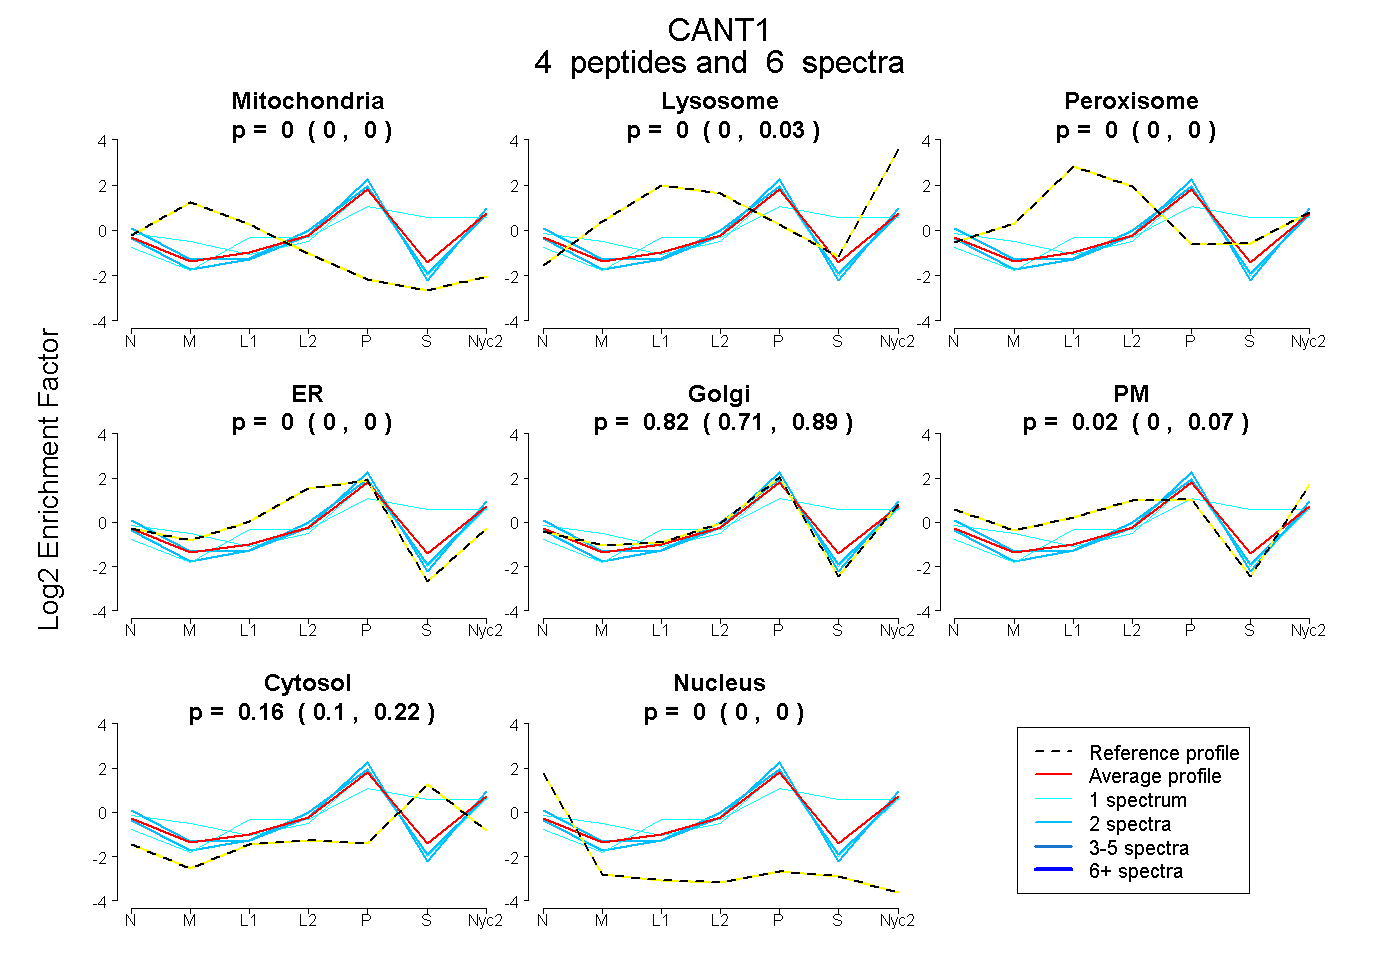
0.000 | 0.000
0.000 | 0.026
0.000 | 0.000
0.000 | 0.000
0.710 | 0.886
0.000 | 0.069
0.097 | 0.217
0.000 | 0.000
1peptide
spectrum
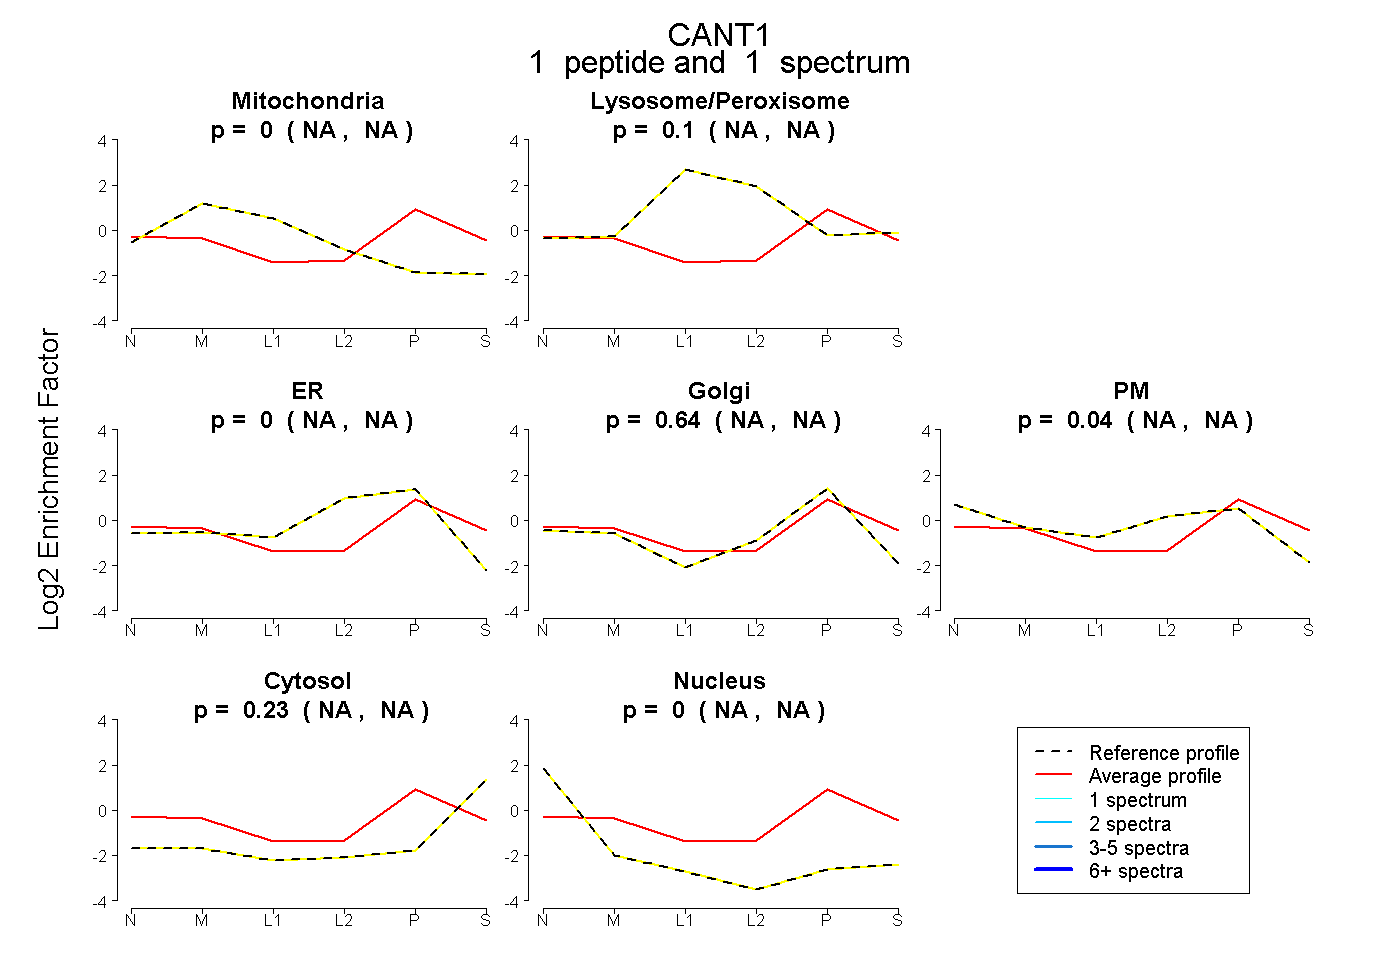
NA | NA
NA | NA
NA | NA
NA | NA
NA | NA
NA | NA
NA | NA
6peptides
spectra
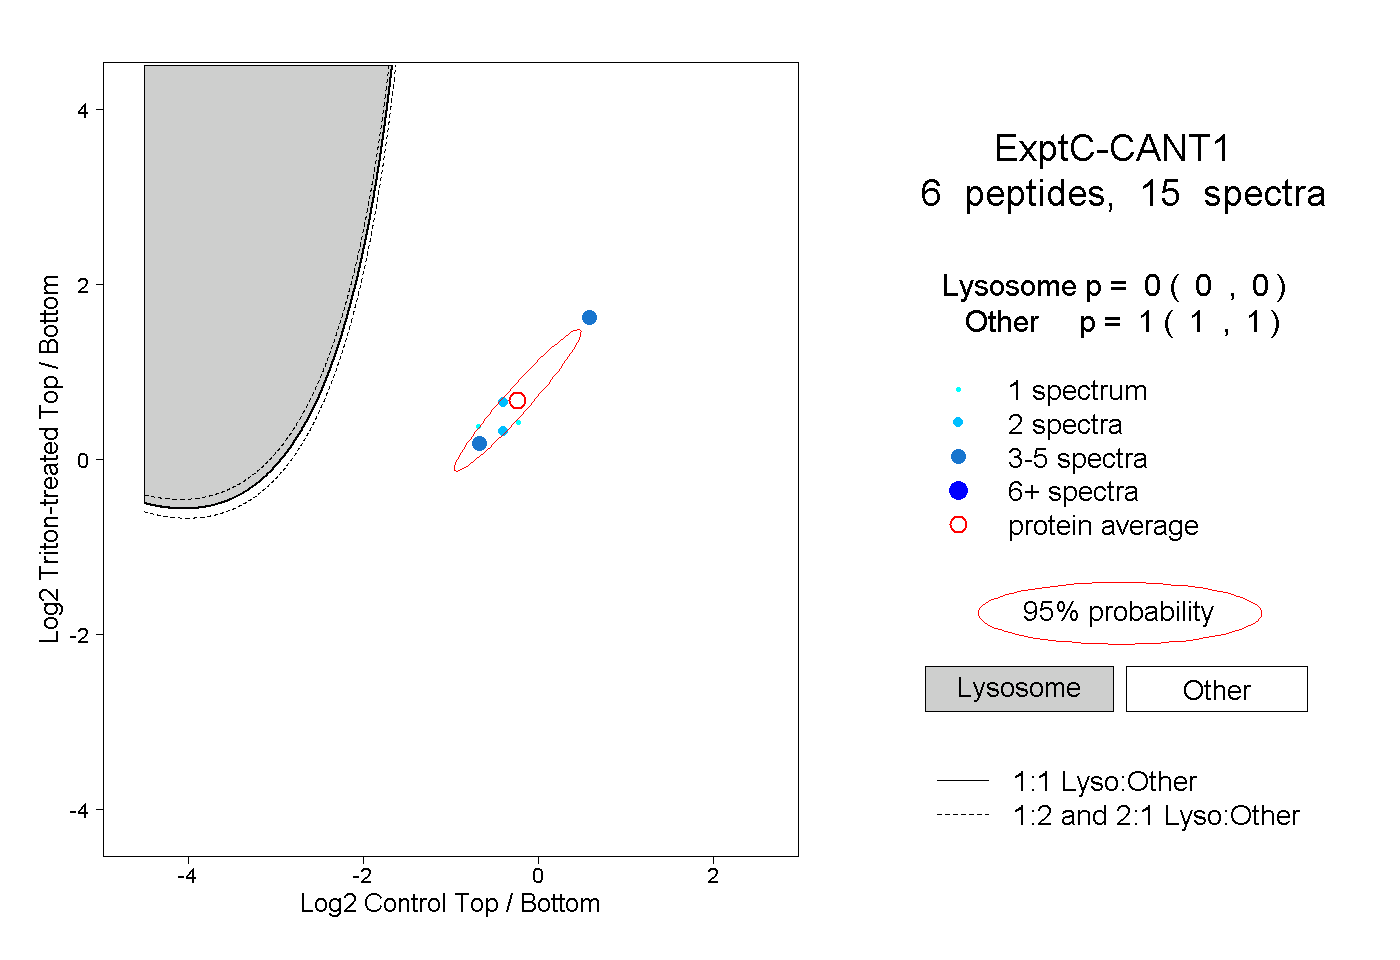
0.000 | 0.000
1.000 | 1.000