9
9peptides
spectra
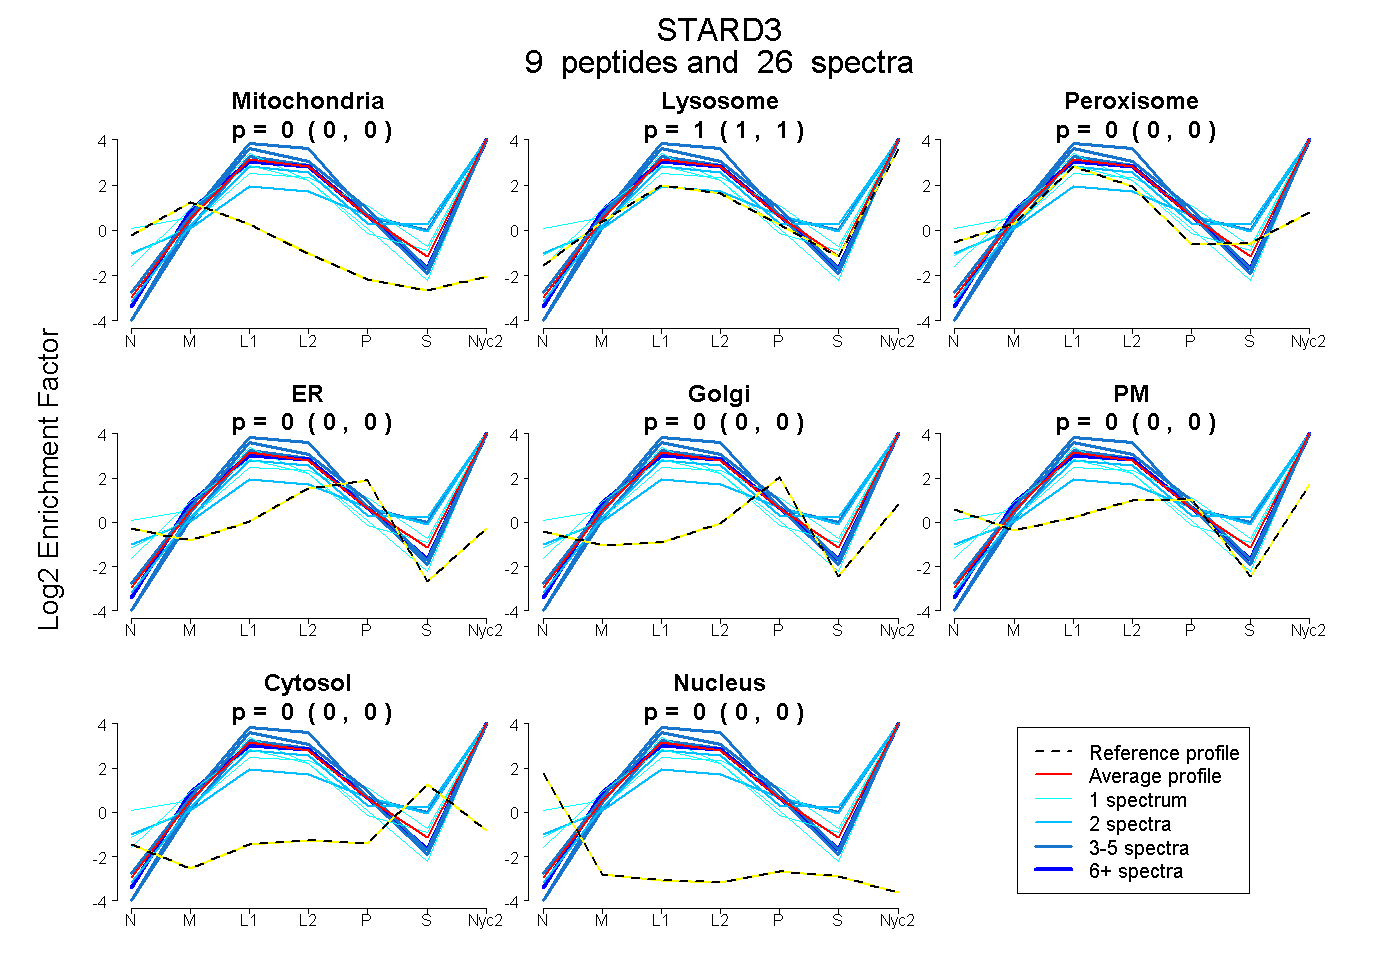
0.000 | 0.000
1.000 | 1.000
0.000 | 0.000
0.000 | 0.000
0.000 | 0.000
0.000 | 0.000
0.000 | 0.000
0.000 | 0.000
6peptides
spectra
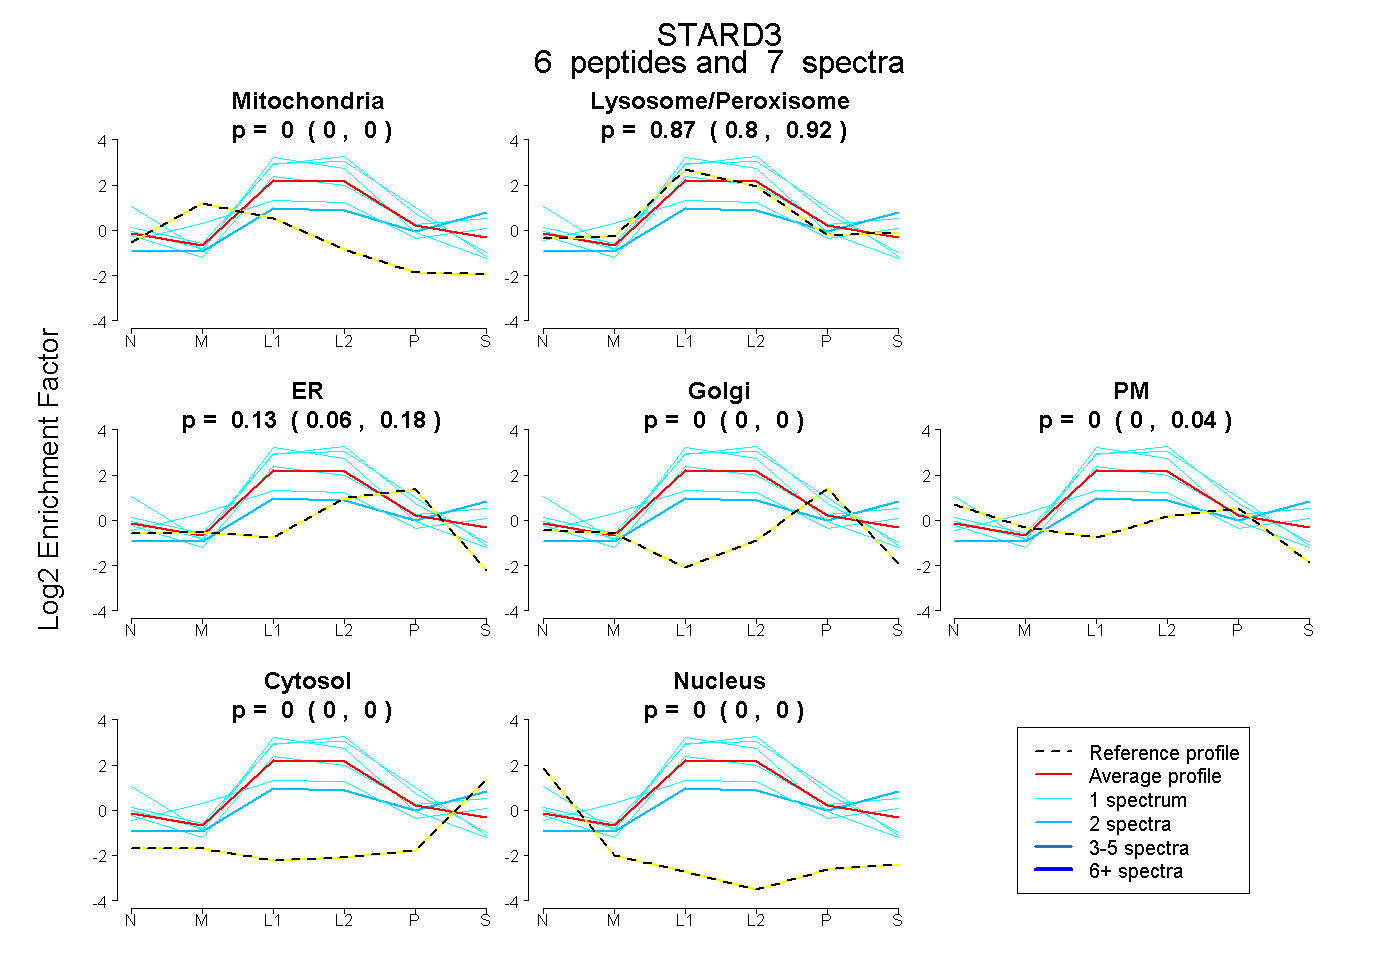
0.000 | 0.000
0.803 | 0.920
0.059 | 0.182
0.000 | 0.000
0.000 | 0.041
0.000 | 0.000
0.000 | 0.000
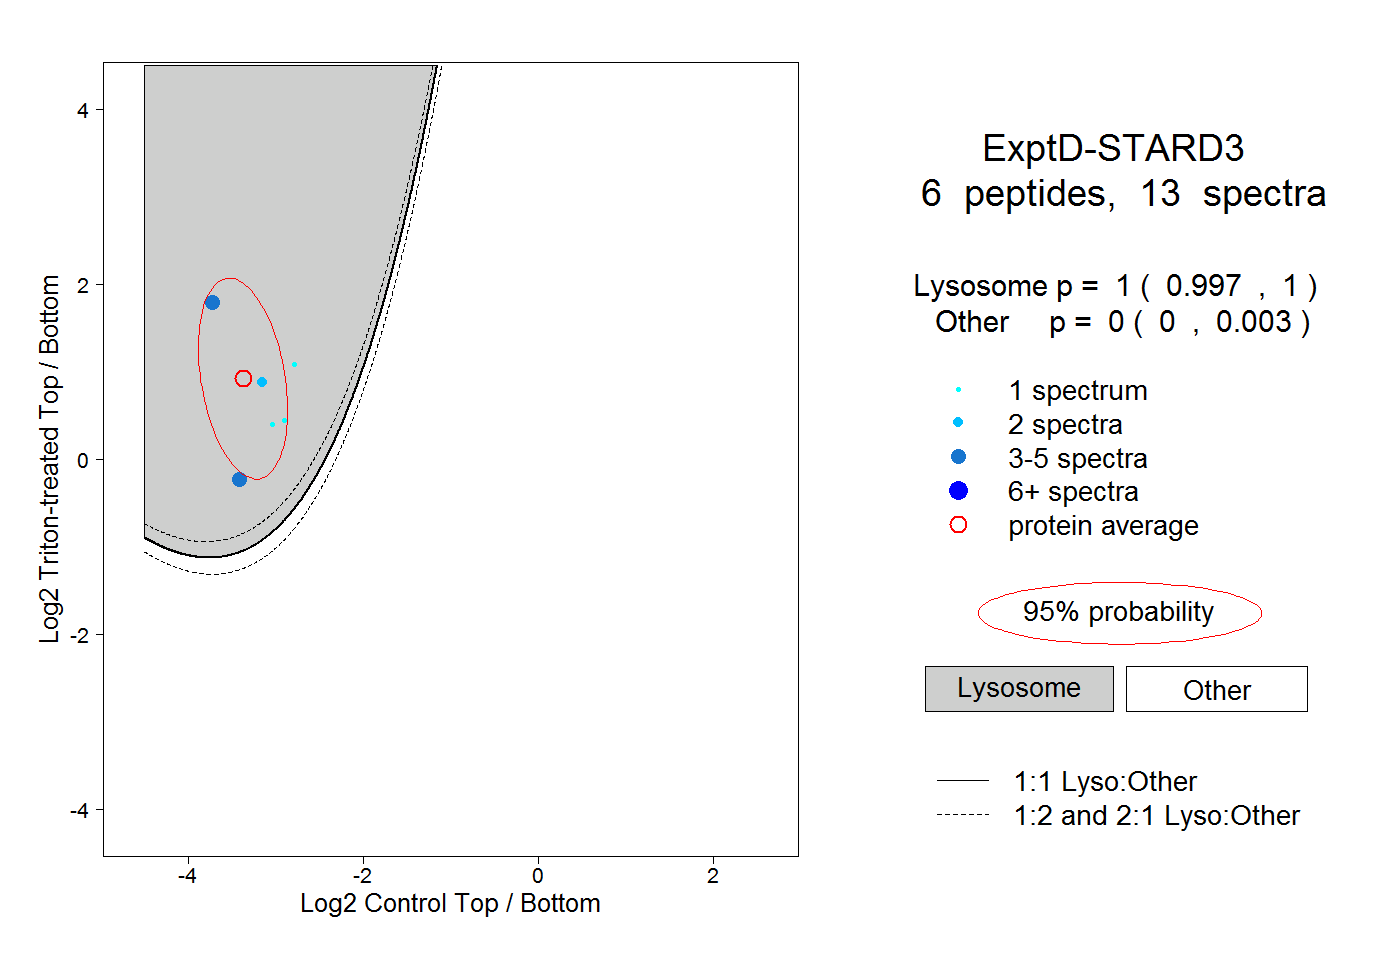
12peptides
spectra
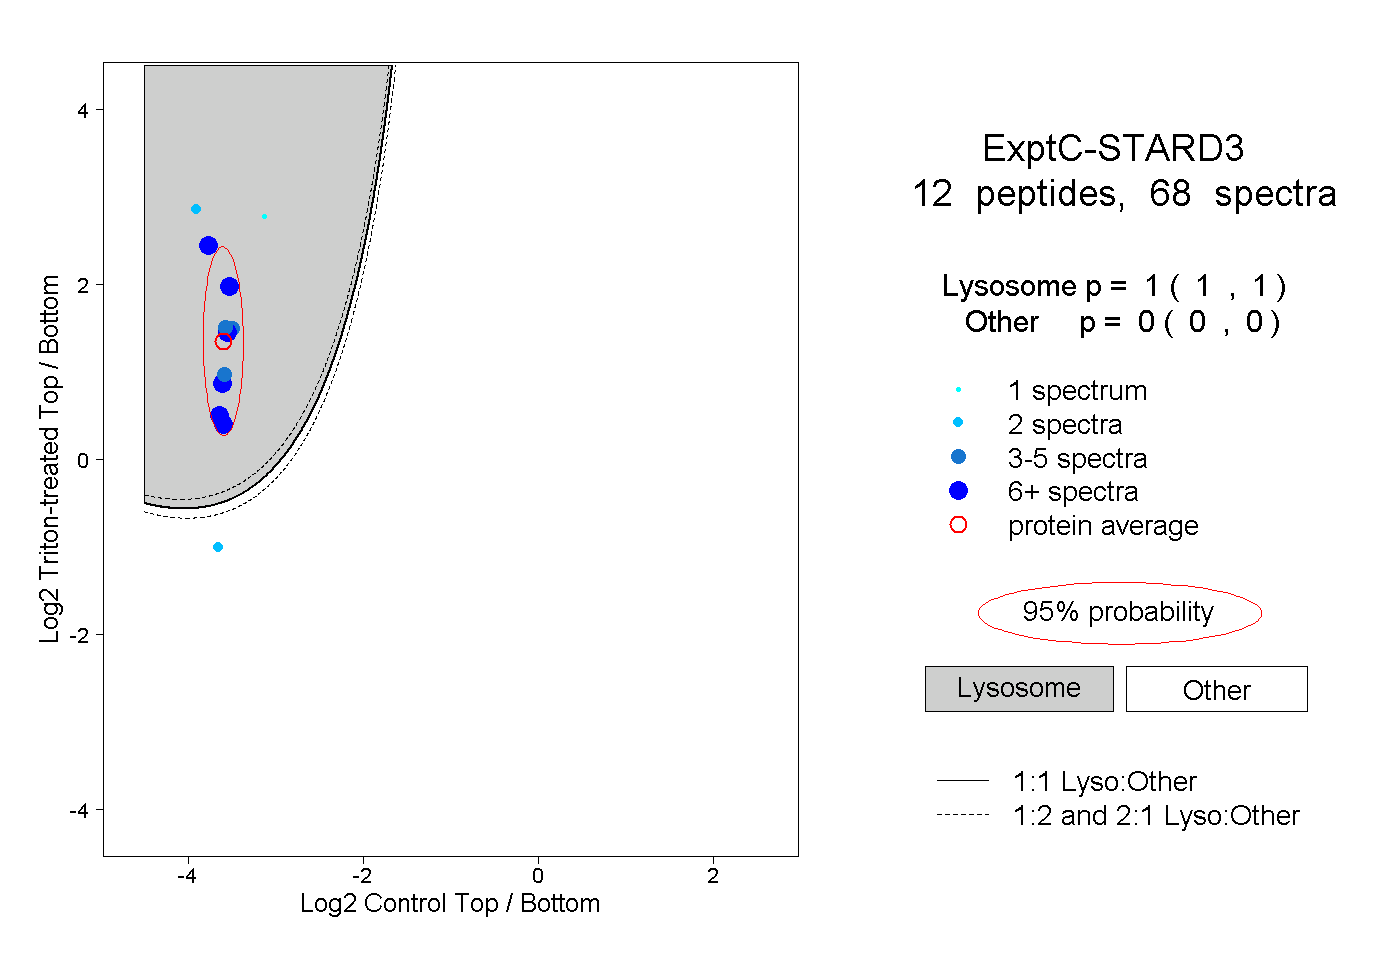
1.000 | 1.000
0.000 | 0.000