17
17peptides
spectra
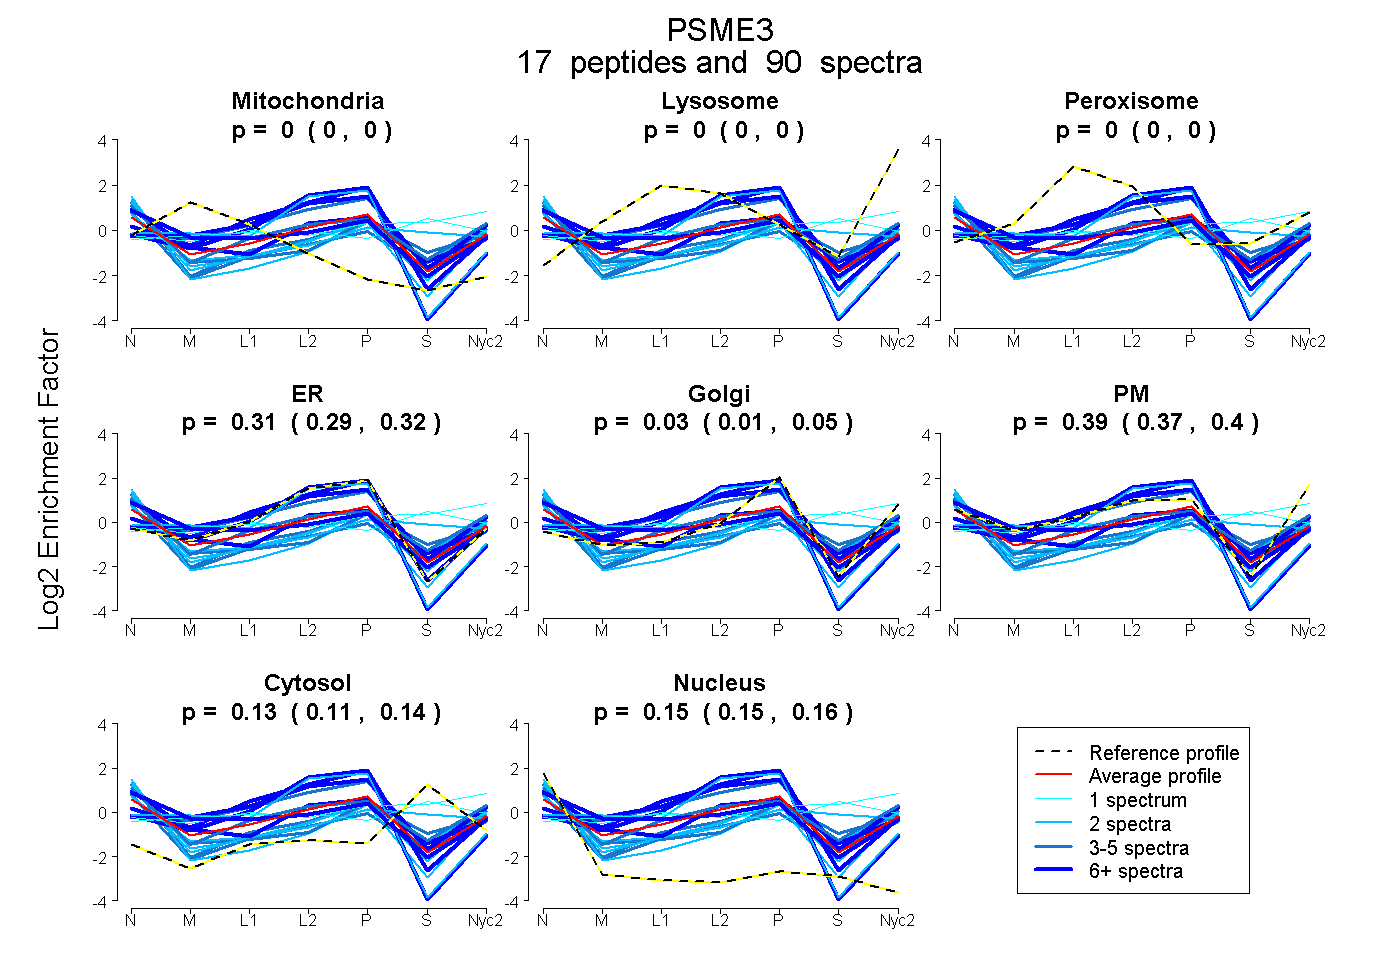
0.000 | 0.000
0.000 | 0.000
0.000 | 0.000
0.288 | 0.319
0.008 | 0.047
0.370 | 0.399
0.115 | 0.136
0.146 | 0.158
9peptides
spectra
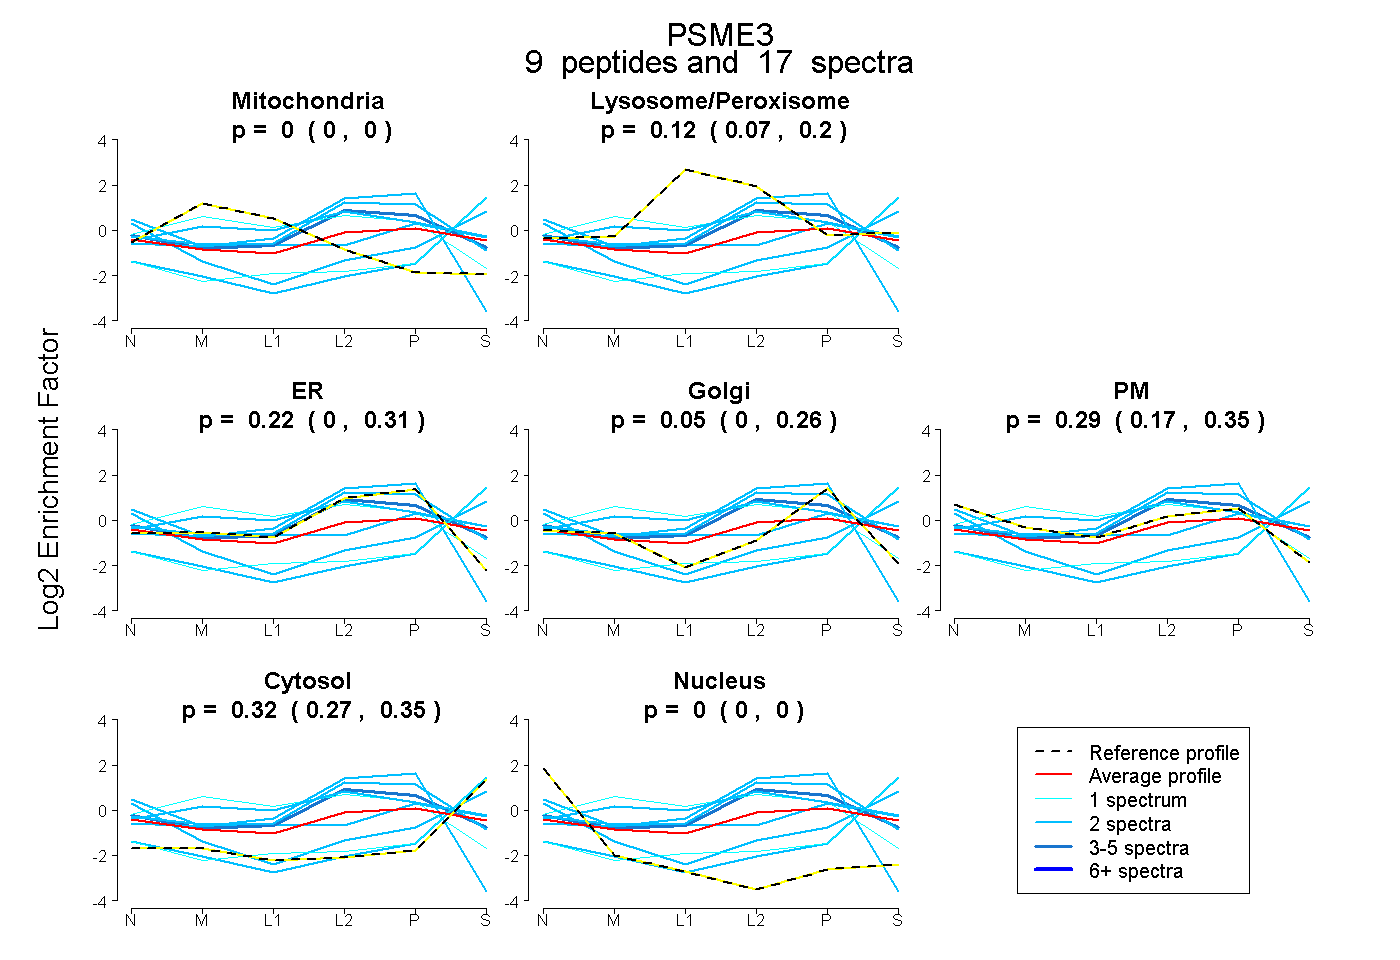
0.000 | 0.000
0.067 | 0.198
0.000 | 0.311
0.000 | 0.261
0.168 | 0.354
0.266 | 0.354
0.000 | 0.000