 17
17peptides
spectra
0.000 | 0.000
0.000 | 0.000
0.000 | 0.000
0.288 | 0.319
0.008 | 0.047
0.370 | 0.399
0.115 | 0.136
0.146 | 0.158
| Plot | Mito | Lyso | Perox | ER | Golgi | PM | Cytosol | Nucleus | |||||
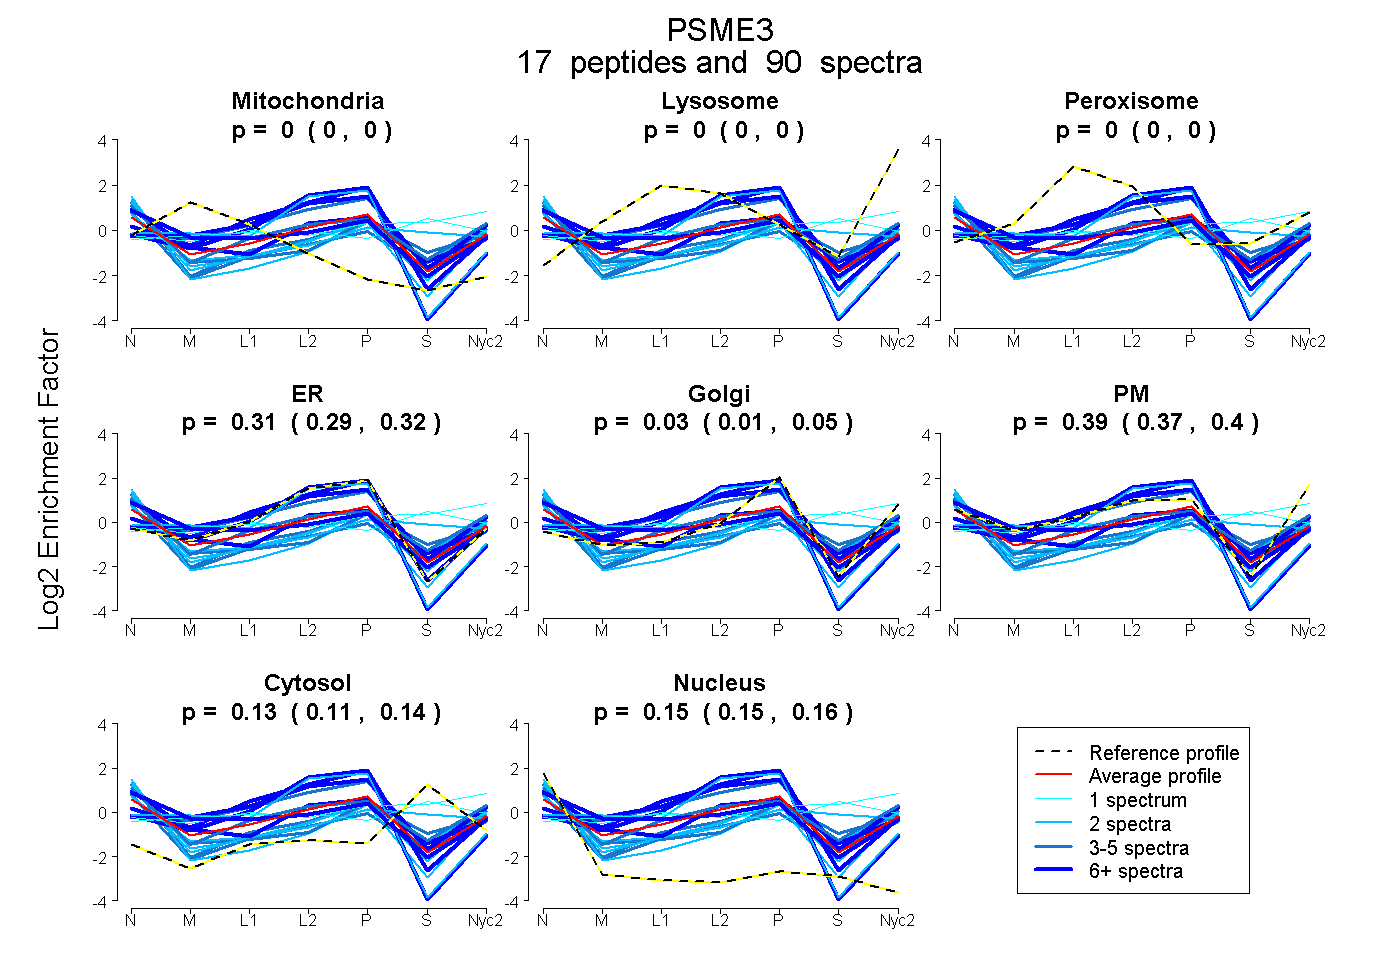
| Expt A |
17 peptides |
90 spectra |
|
0.000 0.000 | 0.000 |
0.000 0.000 | 0.000 |
0.000 0.000 | 0.000 |
0.306 0.288 | 0.319 |
0.029 0.008 | 0.047 |
0.386 0.370 | 0.399 |
0.126 0.115 | 0.136 |
0.152 0.146 | 0.158 |
| 10 spectra, RPVLTR | 0.000 | 0.000 | 0.000 | 0.256 | 0.000 | 0.420 | 0.152 | 0.172 | ||
| 3 spectra, AFTWGR | 0.000 | 0.000 | 0.000 | 0.000 | 0.096 | 0.514 | 0.178 | 0.211 | ||
| 2 spectra, GLQSGDR | 0.000 | 0.000 | 0.000 | 0.000 | 0.150 | 0.447 | 0.179 | 0.224 | ||
| 6 spectra, YHLAVTQR | 0.147 | 0.000 | 0.039 | 0.140 | 0.068 | 0.434 | 0.006 | 0.165 | ||
| 1 spectrum, SSNAETLY | 0.000 | 0.141 | 0.106 | 0.000 | 0.030 | 0.288 | 0.434 | 0.000 | ||
| 2 spectra, STYGFR | 0.102 | 0.000 | 0.000 | 0.894 | 0.000 | 0.000 | 0.000 | 0.004 | ||
| 3 spectra, GGPPPVR | 0.000 | 0.000 | 0.000 | 0.000 | 0.193 | 0.359 | 0.233 | 0.215 | ||
| 10 spectra, GIYNASLQR | 0.058 | 0.000 | 0.000 | 0.917 | 0.000 | 0.000 | 0.000 | 0.025 | ||
| 1 spectrum, TVESEAASYLDQISR | 0.069 | 0.000 | 0.296 | 0.000 | 0.010 | 0.163 | 0.463 | 0.000 | ||
| 3 spectra, AAALAHLDR | 0.000 | 0.000 | 0.000 | 0.000 | 0.134 | 0.422 | 0.190 | 0.253 | ||
| 2 spectra, FSVQGSQVR | 0.000 | 0.000 | 0.000 | 0.000 | 0.321 | 0.308 | 0.000 | 0.371 | ||
| 2 spectra, APPLQFHPEGPR | 0.000 | 0.000 | 0.000 | 0.000 | 0.168 | 0.521 | 0.009 | 0.302 | ||
| 26 spectra, LLGQTHK | 0.000 | 0.000 | 0.000 | 0.985 | 0.000 | 0.010 | 0.000 | 0.005 | ||
| 2 spectra, QGHNLLK | 0.000 | 0.000 | 0.000 | 0.000 | 0.026 | 0.410 | 0.446 | 0.119 | ||
| 5 spectra, GLGVDLLWTLEK | 0.075 | 0.000 | 0.117 | 0.636 | 0.102 | 0.000 | 0.071 | 0.000 | ||
| 3 spectra, VFYQGR | 0.000 | 0.000 | 0.006 | 0.051 | 0.000 | 0.629 | 0.196 | 0.118 | ||
| 9 spectra, MNVLHDFGIQSTR | 0.000 | 0.000 | 0.248 | 0.442 | 0.302 | 0.000 | 0.008 | 0.000 |
| Plot | Mito | Lyso or Perox | ER | Golgi | PM | Cytosol | Nucleus | ||||||
| Expt B |
9 peptides |
17 spectra |
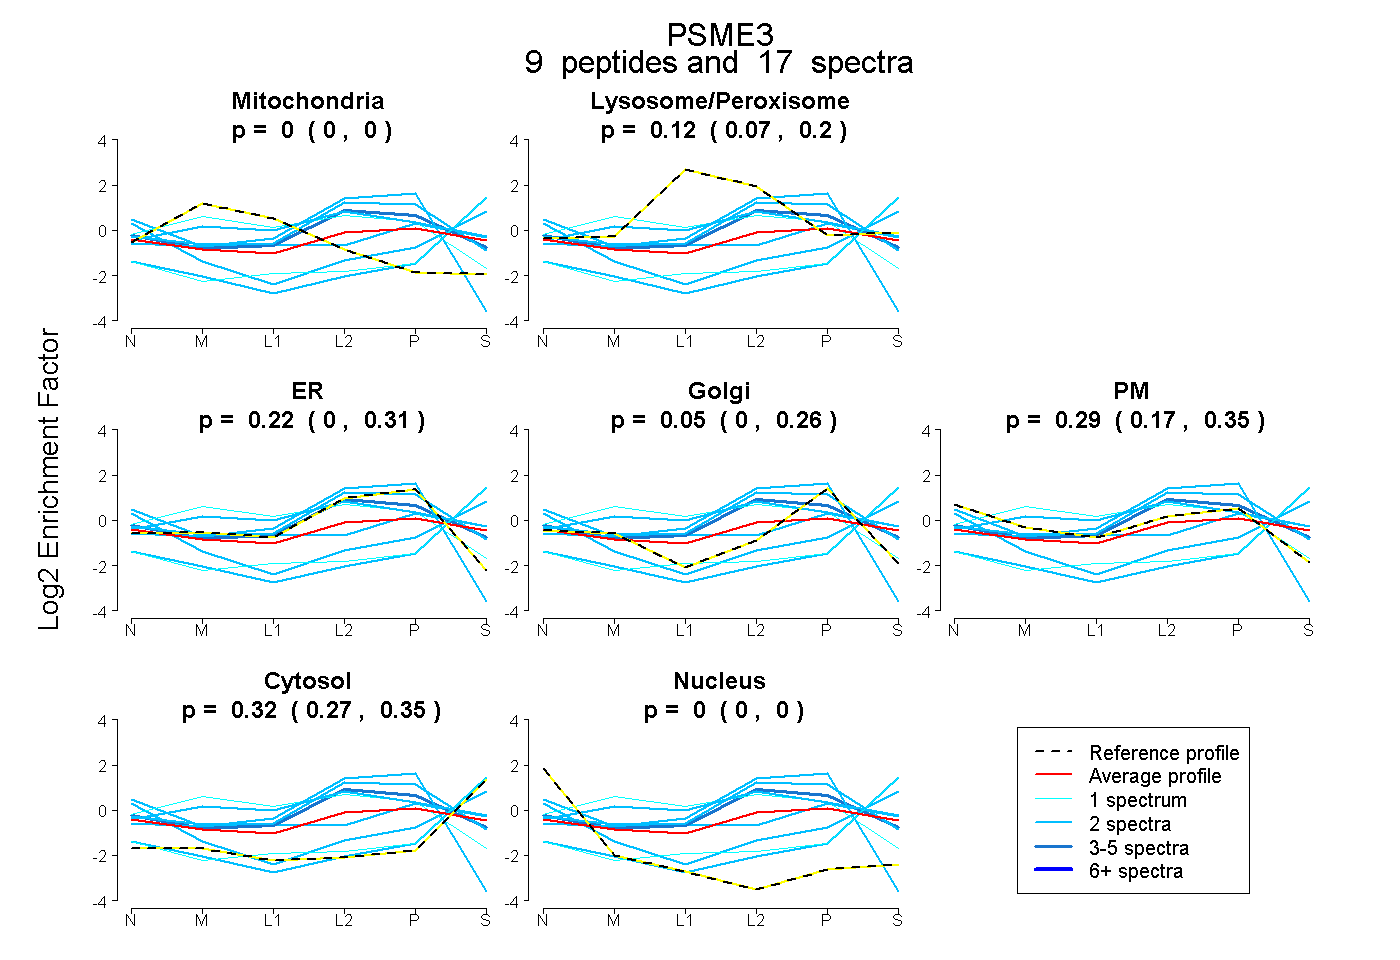 |
0.000 0.000 | 0.000 |
0.118 0.067 | 0.198 |
0.220 0.000 | 0.311 |
0.050 0.000 | 0.261 |
0.287 0.168 | 0.354 |
0.325 0.266 | 0.354 |
0.000 0.000 | 0.000 |
|||
| Plot | Lyso | Other | |||||||||||
| Expt C |
12 peptides |
74 spectra |
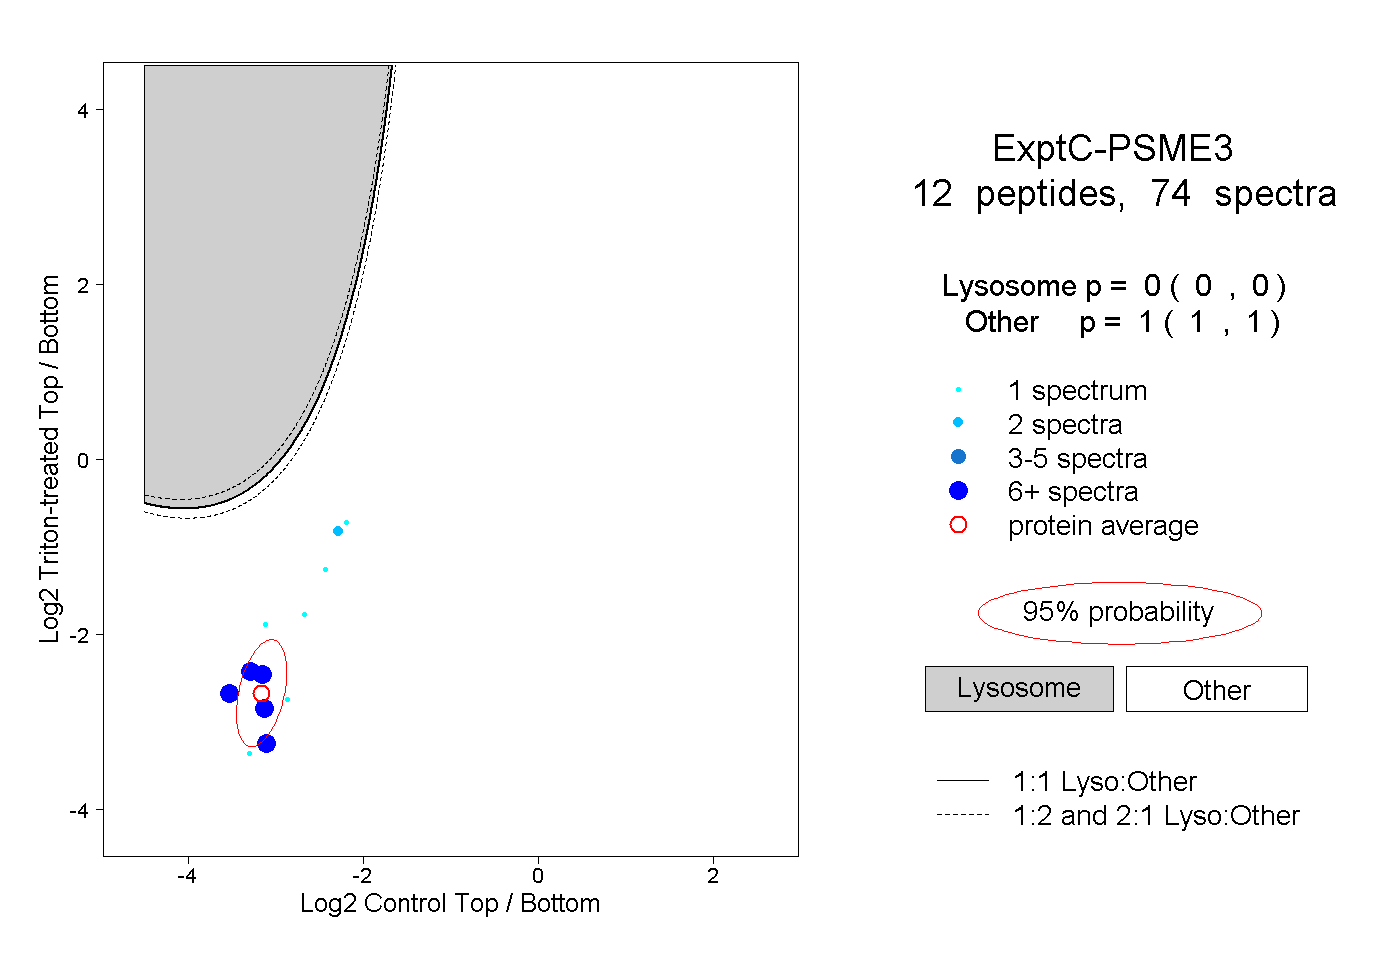 |
0.000 0.000 | 0.000 |
1.000 1.000 | 1.000 |
||||||||
| Plot | Lyso | Other | |||||||||||
| Expt D |
2 peptides |
9 spectra |
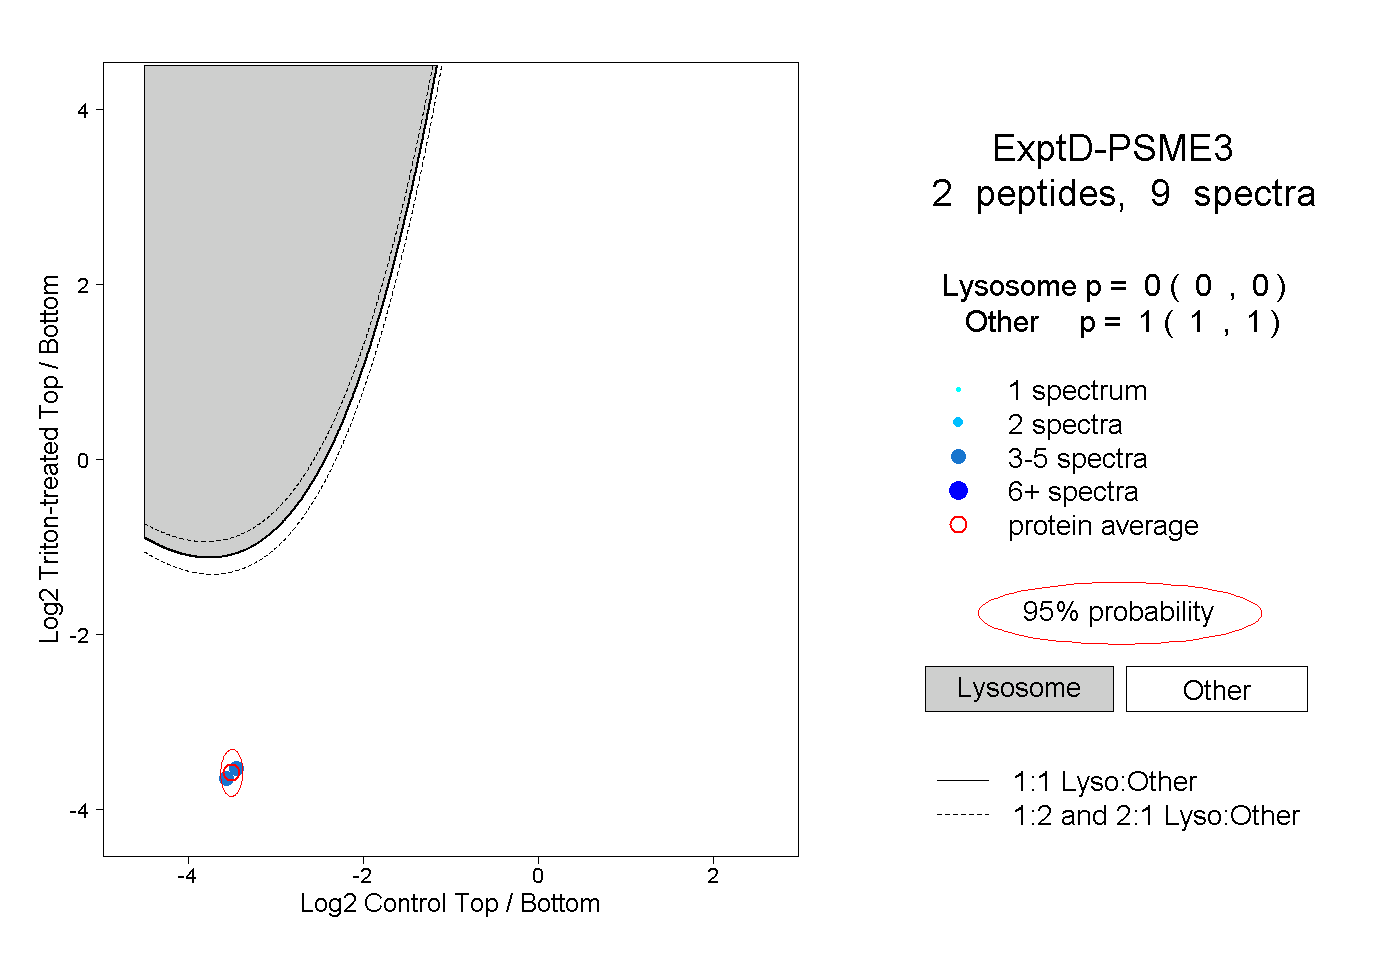 |
0.000 0.000 | 0.000 |
1.000 1.000 | 1.000 |