 1
1peptide
spectra
0.651 | 0.797
0.047 | 0.184
0.000 | 0.000
0.000 | 0.000
0.000 | 0.000
0.082 | 0.197
0.000 | 0.000
0.000 | 0.000
1peptide
spectra
NA | NA
NA | NA
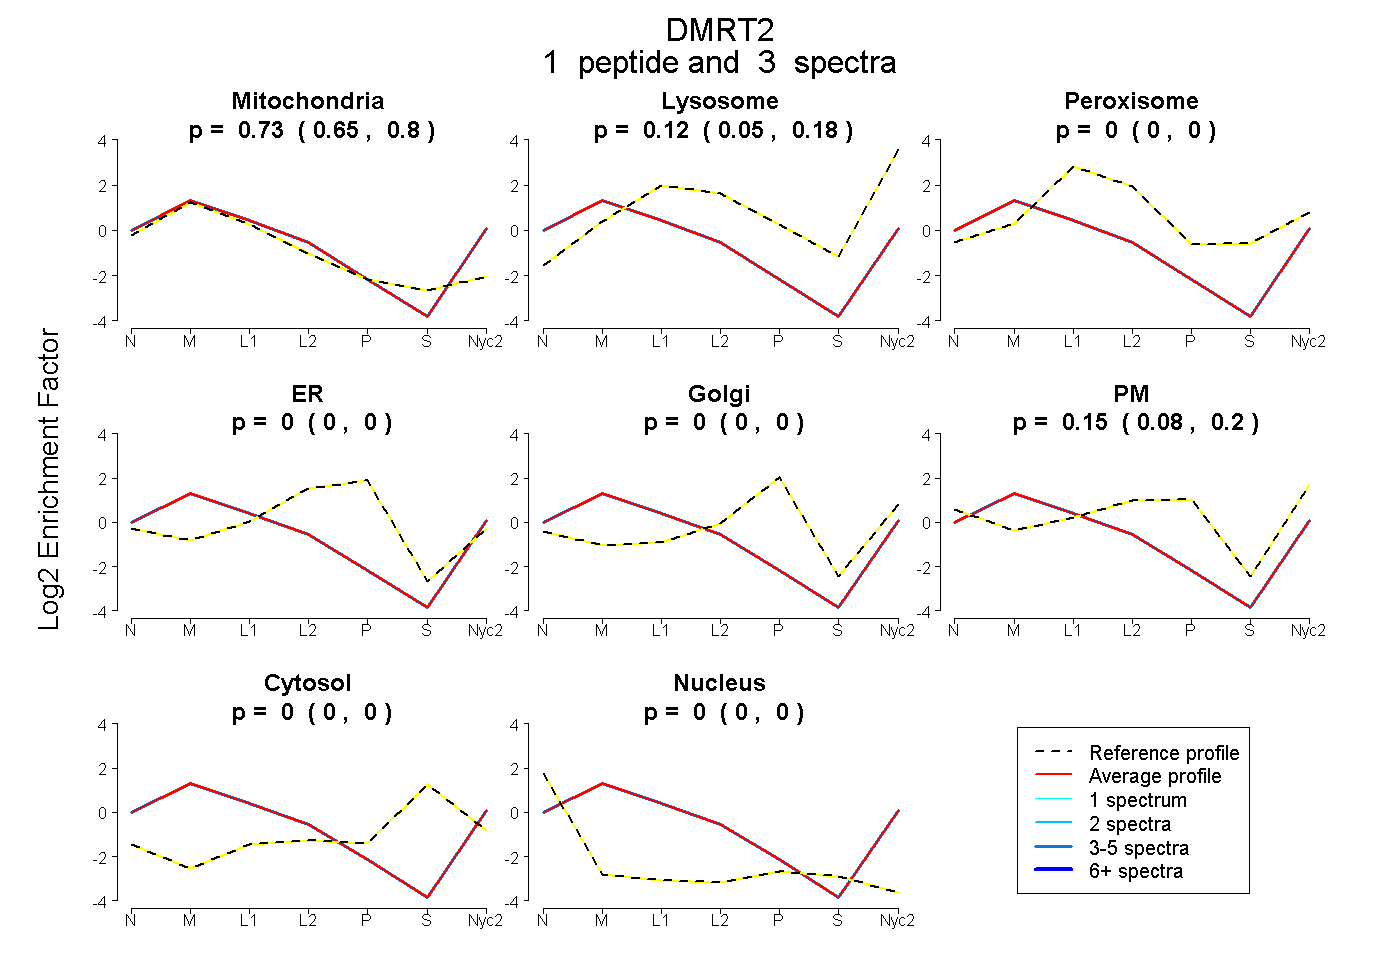
| Plot | Mito | Lyso | Perox | ER | Golgi | PM | Cytosol | Nucleus | |||||
| Expt A |
1 peptide |
3 spectra |
|
0.733 0.651 | 0.797 |
0.120 0.047 | 0.184 |
0.000 0.000 | 0.000 |
0.000 0.000 | 0.000 |
0.000 0.000 | 0.000 |
0.147 0.082 | 0.197 |
0.000 0.000 | 0.000 |
0.000 0.000 | 0.000 |
||
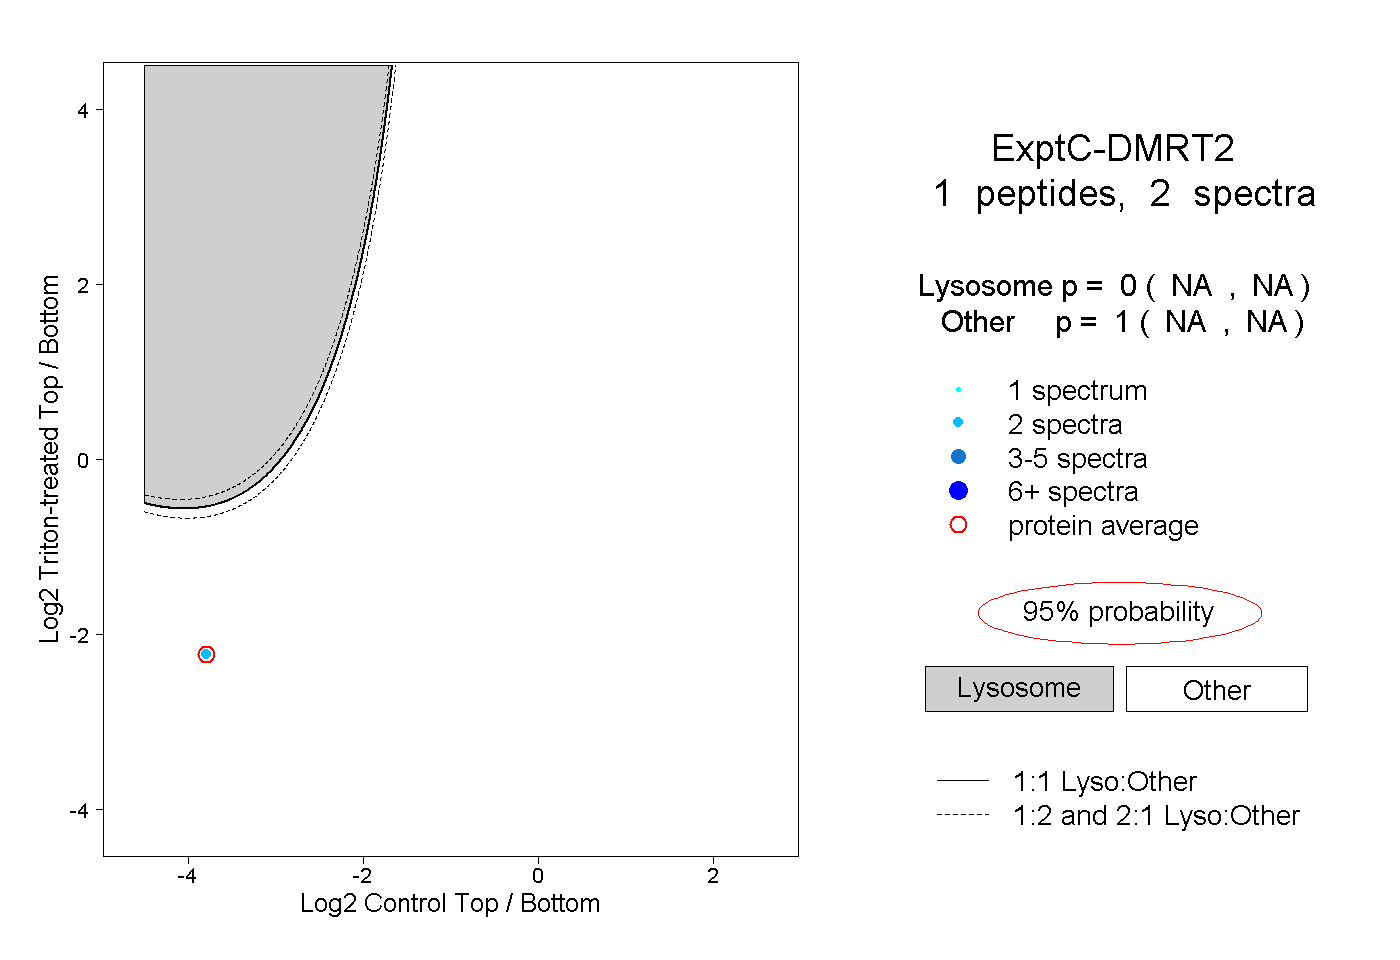
| Plot | Lyso | Other | |||||||||||
| Expt C |
1 peptide |
2 spectra |
|
0.000 NA | NA |
1.000 NA | NA |