21
21peptides
spectra
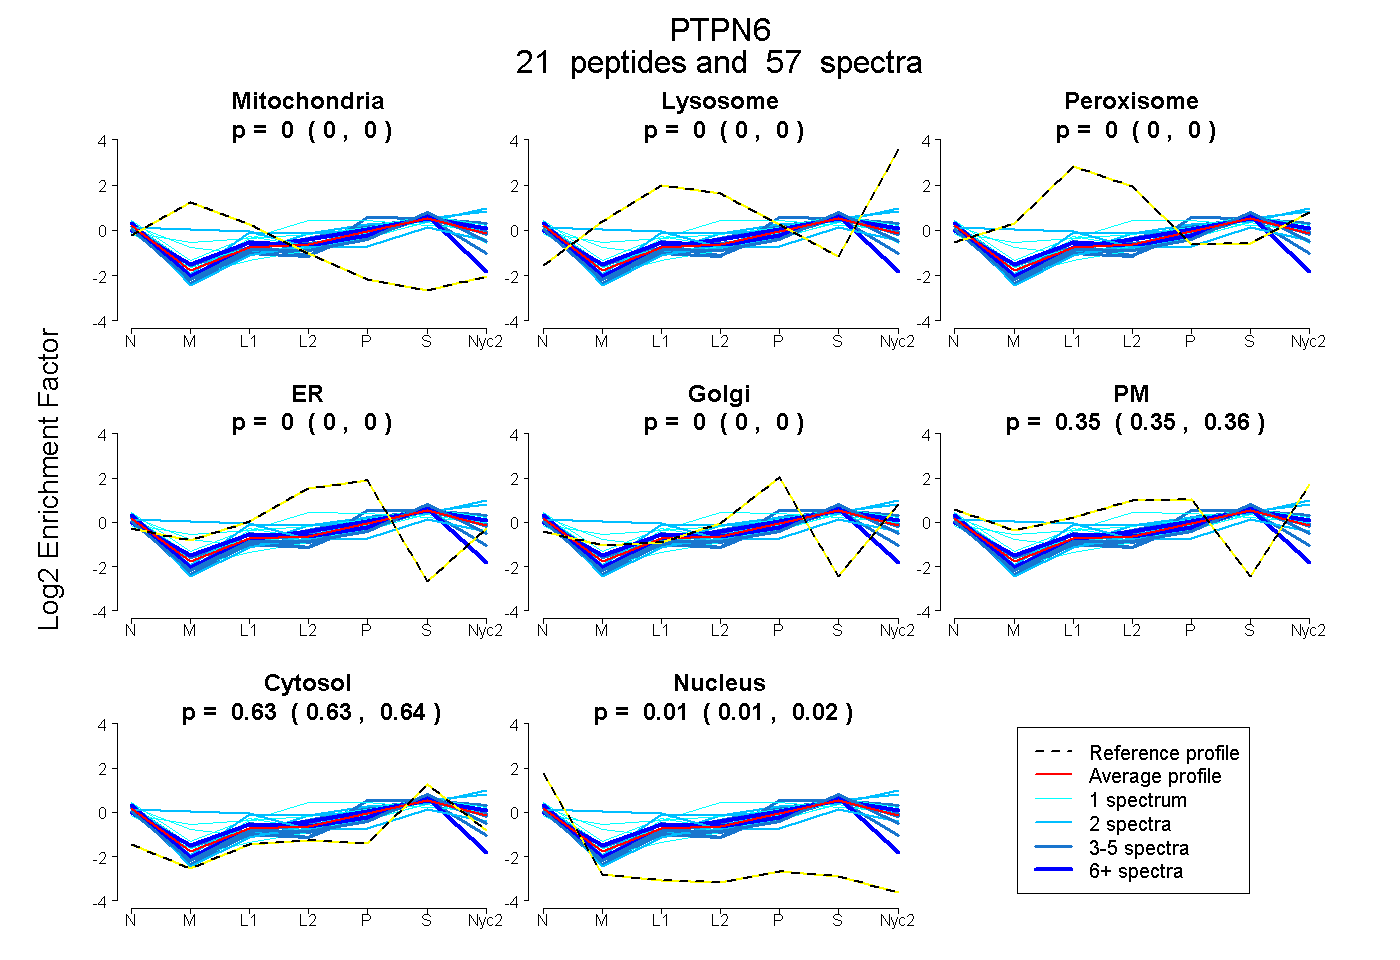
0.000 | 0.000
0.000 | 0.000
0.000 | 0.000
0.000 | 0.000
0.000 | 0.000
0.350 | 0.356
0.632 | 0.636
0.009 | 0.015
13peptides
spectra
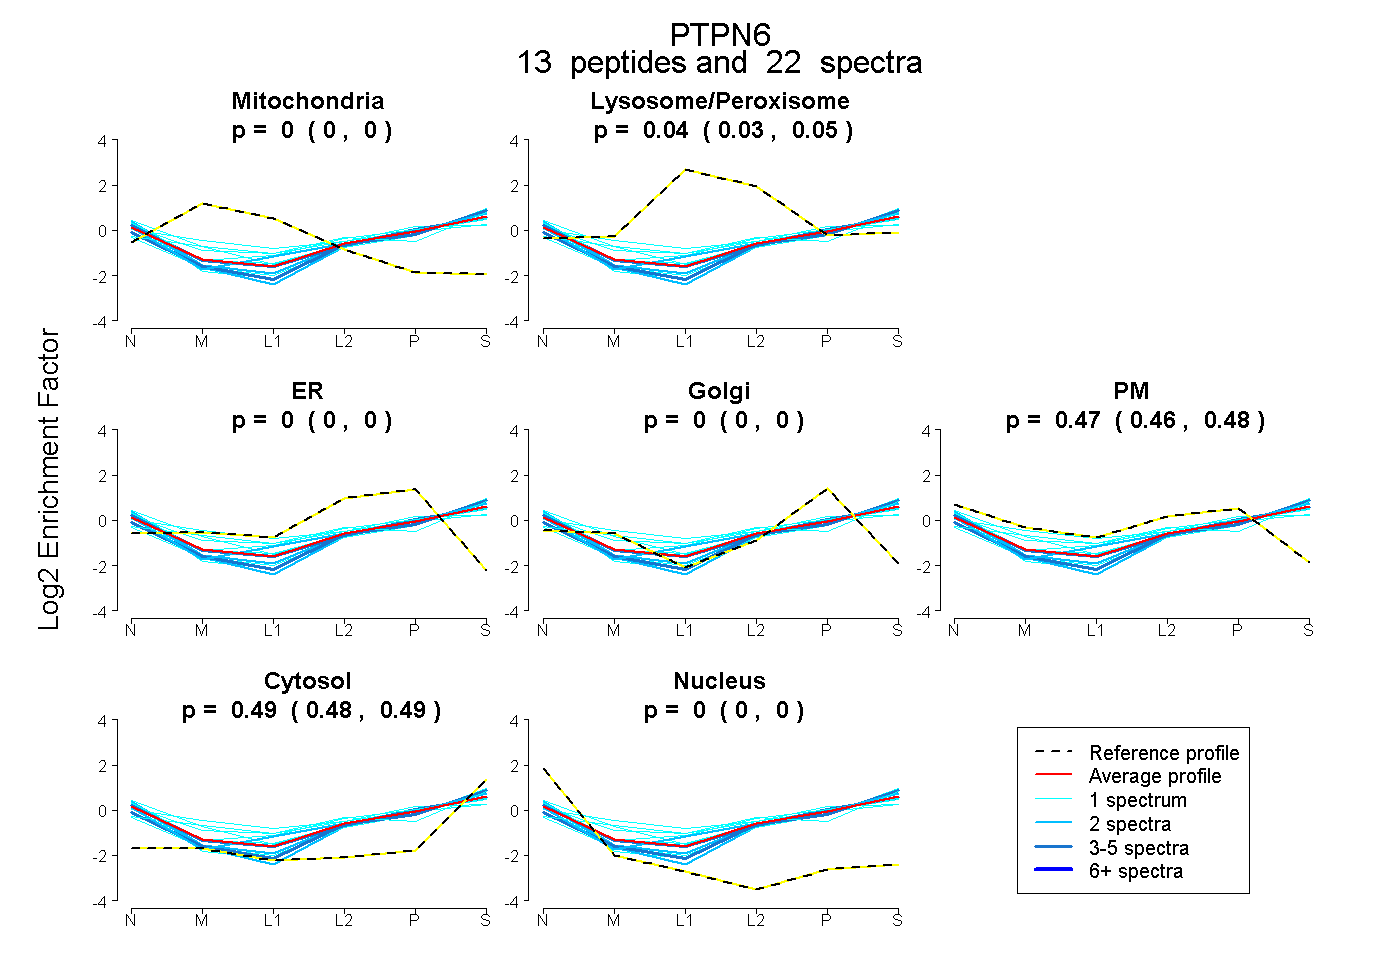
0.000 | 0.000
0.027 | 0.047
0.000 | 0.000
0.000 | 0.000
0.464 | 0.483
0.483 | 0.492
0.000 | 0.000