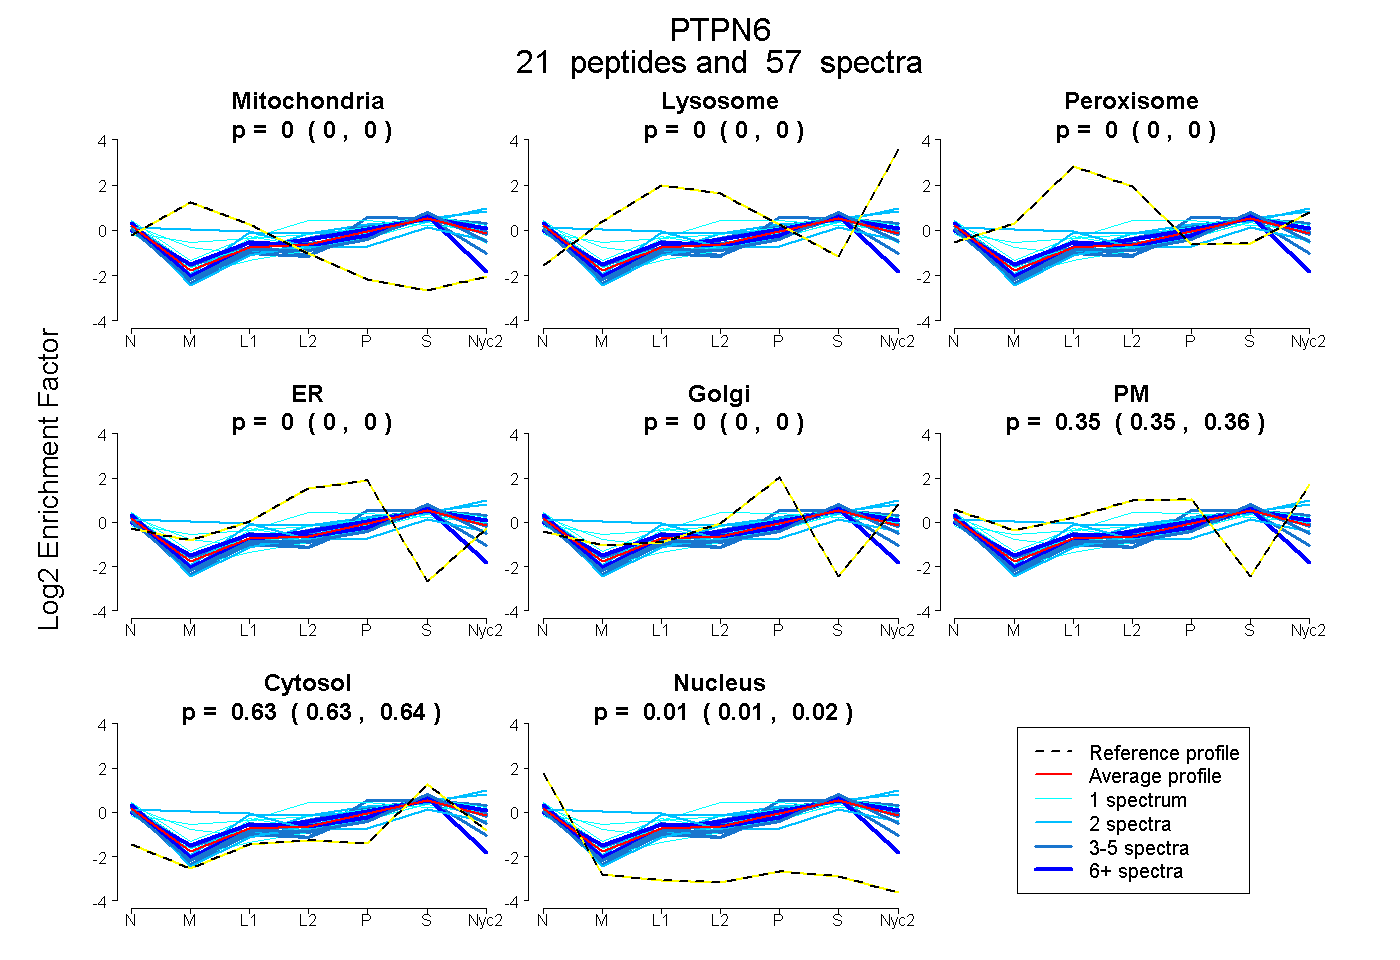
 21
21peptides
spectra
0.000 | 0.000
0.000 | 0.000
0.000 | 0.000
0.000 | 0.000
0.000 | 0.000
0.350 | 0.356
0.632 | 0.636
0.009 | 0.015
| Plot | Mito | Lyso | Perox | ER | Golgi | PM | Cytosol | Nucleus | |||||
| Expt A |
21 peptides |
57 spectra |
|
0.000 0.000 | 0.000 |
0.000 0.000 | 0.000 |
0.000 0.000 | 0.000 |
0.000 0.000 | 0.000 |
0.000 0.000 | 0.000 |
0.353 0.350 | 0.356 |
0.634 0.632 | 0.636 |
0.012 0.009 | 0.015 |
| 1 spectrum, ESLSQPGDFVLSVLNDQPK | 0.000 | 0.000 | 0.116 | 0.000 | 0.000 | 0.319 | 0.522 | 0.043 | ||
| 2 spectra, NQLLGPDENSK | 0.000 | 0.000 | 0.000 | 0.000 | 0.000 | 0.466 | 0.534 | 0.000 | ||
| 1 spectrum, CVPYWPEVGTQR | 0.000 | 0.000 | 0.000 | 0.064 | 0.000 | 0.221 | 0.701 | 0.014 | ||
| 2 spectra, VNAADIENR | 0.265 | 0.000 | 0.164 | 0.000 | 0.000 | 0.164 | 0.407 | 0.000 | ||
| 8 spectra, VMCEGGR | 0.000 | 0.000 | 0.147 | 0.164 | 0.000 | 0.000 | 0.556 | 0.134 | ||
| 6 spectra, VIVMTTR | 0.000 | 0.000 | 0.000 | 0.000 | 0.000 | 0.379 | 0.621 | 0.000 | ||
| 1 spectrum, LEGQRPENK | 0.000 | 0.000 | 0.000 | 0.000 | 0.102 | 0.188 | 0.660 | 0.050 | ||
| 2 spectra, VILQGR | 0.000 | 0.005 | 0.092 | 0.000 | 0.000 | 0.385 | 0.518 | 0.000 | ||
| 4 spectra, AGPGSPLR | 0.000 | 0.000 | 0.000 | 0.000 | 0.000 | 0.278 | 0.689 | 0.032 | ||
| 1 spectrum, DGTIIHLK | 0.069 | 0.000 | 0.000 | 0.000 | 0.000 | 0.351 | 0.558 | 0.021 | ||
| 1 spectrum, IQNSGDFYDLYGGEK | 0.000 | 0.000 | 0.000 | 0.000 | 0.000 | 0.387 | 0.611 | 0.002 | ||
| 2 spectra, GEPWTFLVR | 0.000 | 0.000 | 0.000 | 0.000 | 0.000 | 0.303 | 0.652 | 0.045 | ||
| 4 spectra, GLDCDIDIQK | 0.000 | 0.000 | 0.124 | 0.150 | 0.000 | 0.057 | 0.562 | 0.107 | ||
| 3 spectra, DLSGPDAETLLK | 0.000 | 0.000 | 0.000 | 0.000 | 0.007 | 0.300 | 0.656 | 0.037 | ||
| 3 spectra, EHDTAEYK | 0.000 | 0.000 | 0.000 | 0.058 | 0.000 | 0.310 | 0.629 | 0.003 | ||
| 5 spectra, YPLNCSDPTSER | 0.000 | 0.000 | 0.010 | 0.000 | 0.000 | 0.234 | 0.717 | 0.039 | ||
| 2 spectra, VDDQVTHIR | 0.000 | 0.000 | 0.000 | 0.000 | 0.032 | 0.296 | 0.646 | 0.025 | ||
| 1 spectrum, TIQMVR | 0.000 | 0.000 | 0.076 | 0.000 | 0.000 | 0.341 | 0.583 | 0.000 | ||
| 1 spectrum, SGMVQTEAQYK | 0.000 | 0.000 | 0.178 | 0.162 | 0.000 | 0.248 | 0.412 | 0.000 | ||
| 4 spectra, QPYYATR | 0.000 | 0.000 | 0.000 | 0.000 | 0.295 | 0.110 | 0.596 | 0.000 | ||
| 3 spectra, AGFWEEFESLQK | 0.000 | 0.000 | 0.000 | 0.000 | 0.029 | 0.341 | 0.618 | 0.011 |
| Plot | Mito | Lyso or Perox | ER | Golgi | PM | Cytosol | Nucleus | ||||||
| Expt B |
13 peptides |
22 spectra |
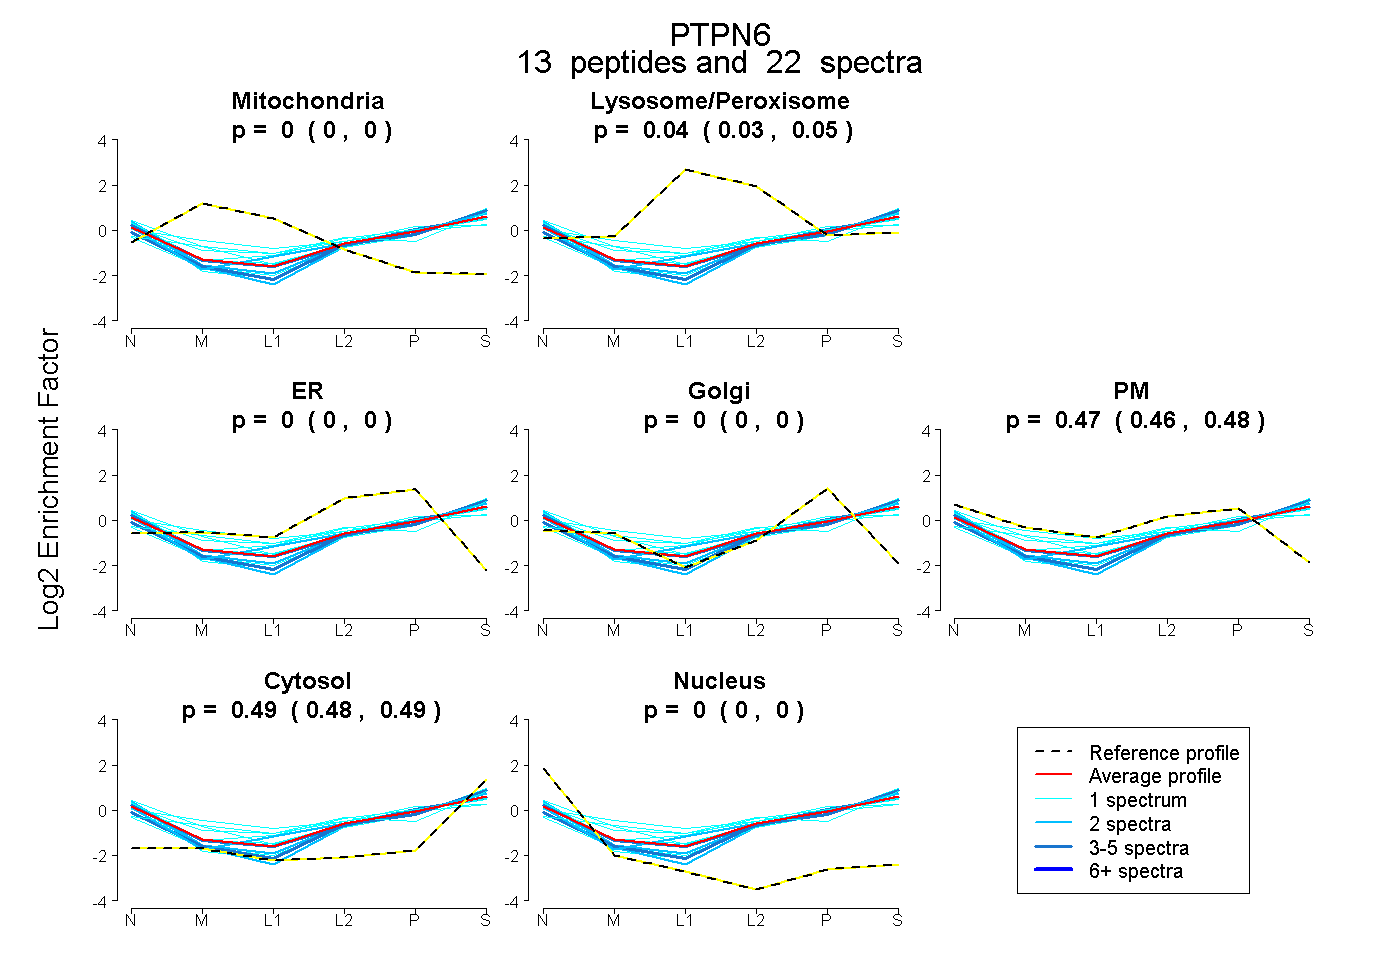 |
0.000 0.000 | 0.000 |
0.038 0.027 | 0.047 |
0.000 0.000 | 0.000 |
0.000 0.000 | 0.000 |
0.474 0.464 | 0.483 |
0.488 0.483 | 0.492 |
0.000 0.000 | 0.000 |
|||
| Plot | Lyso | Other | |||||||||||
| Expt C |
20 peptides |
57 spectra |
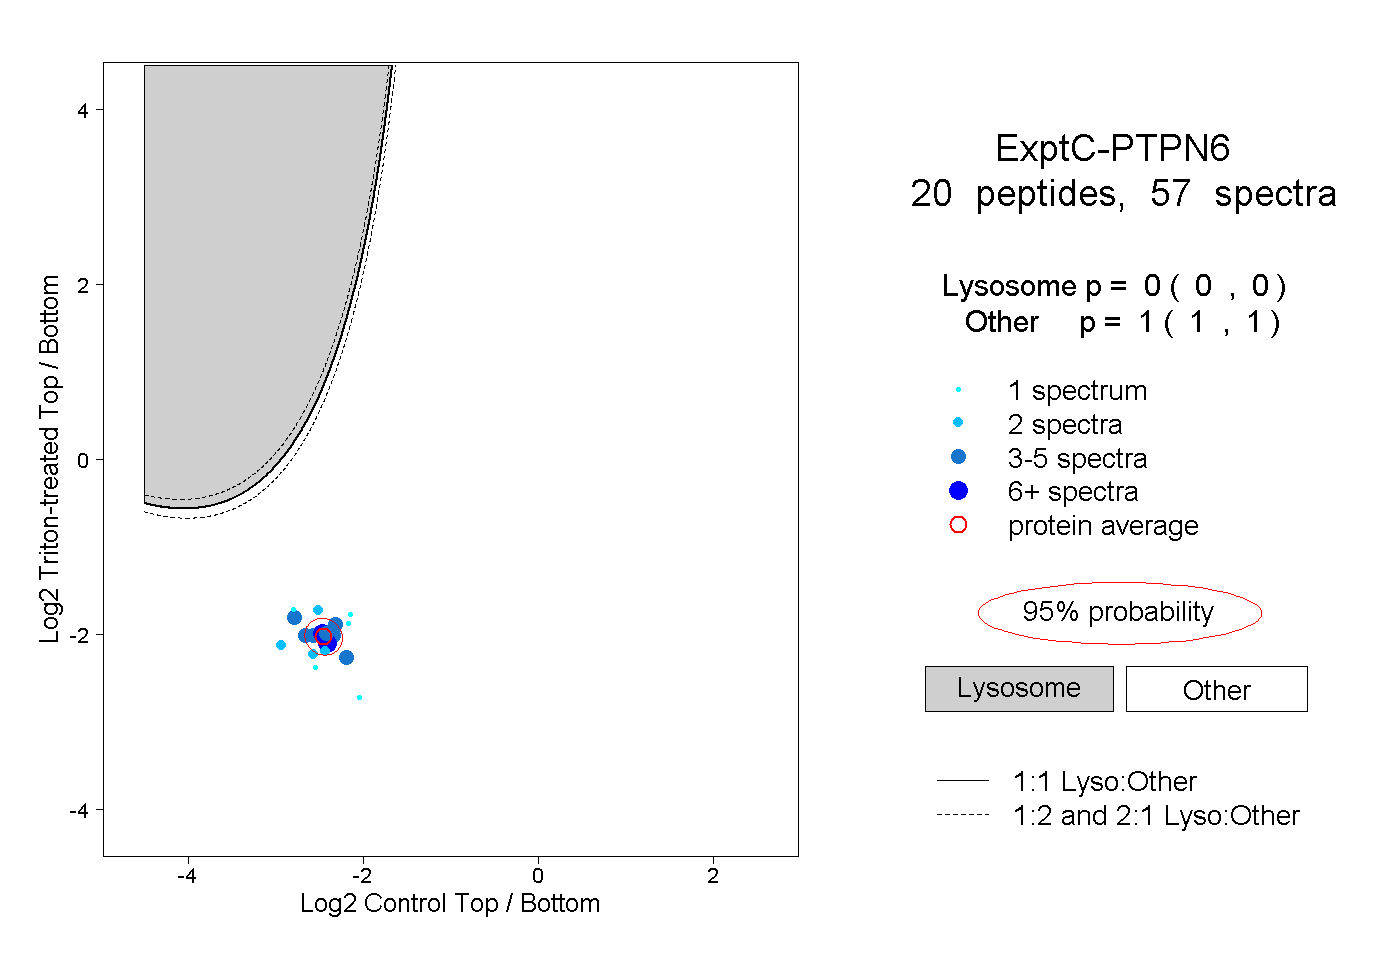 |
0.000 0.000 | 0.000 |
1.000 1.000 | 1.000 |
||||||||
| Plot | Lyso | Other | |||||||||||
| Expt D |
4 peptides |
7 spectra |
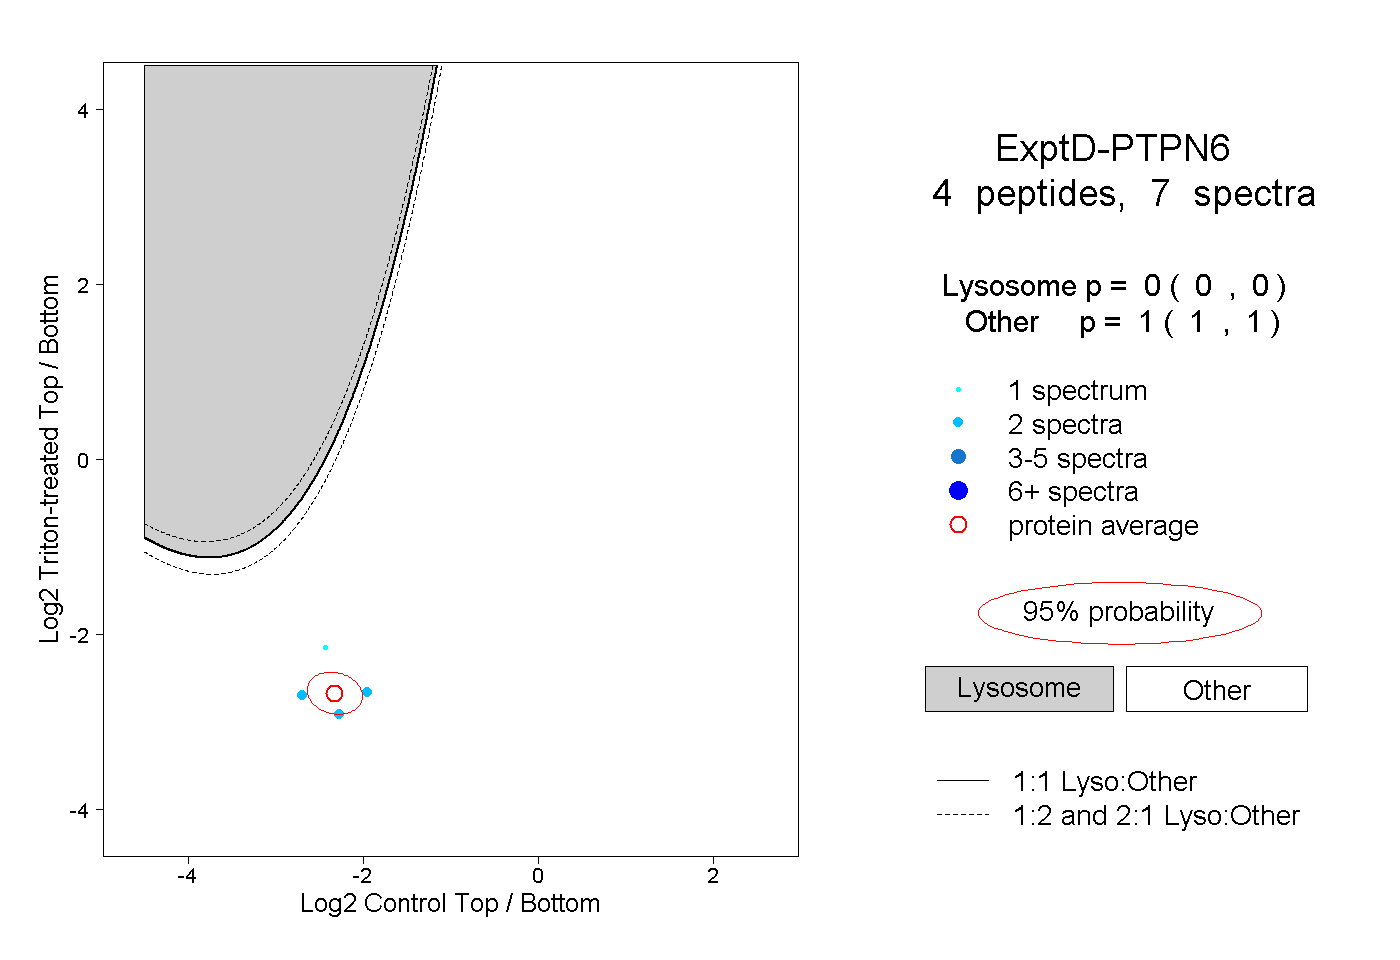 |
0.000 0.000 | 0.000 |
1.000 1.000 | 1.000 |