 6
6peptides
spectra
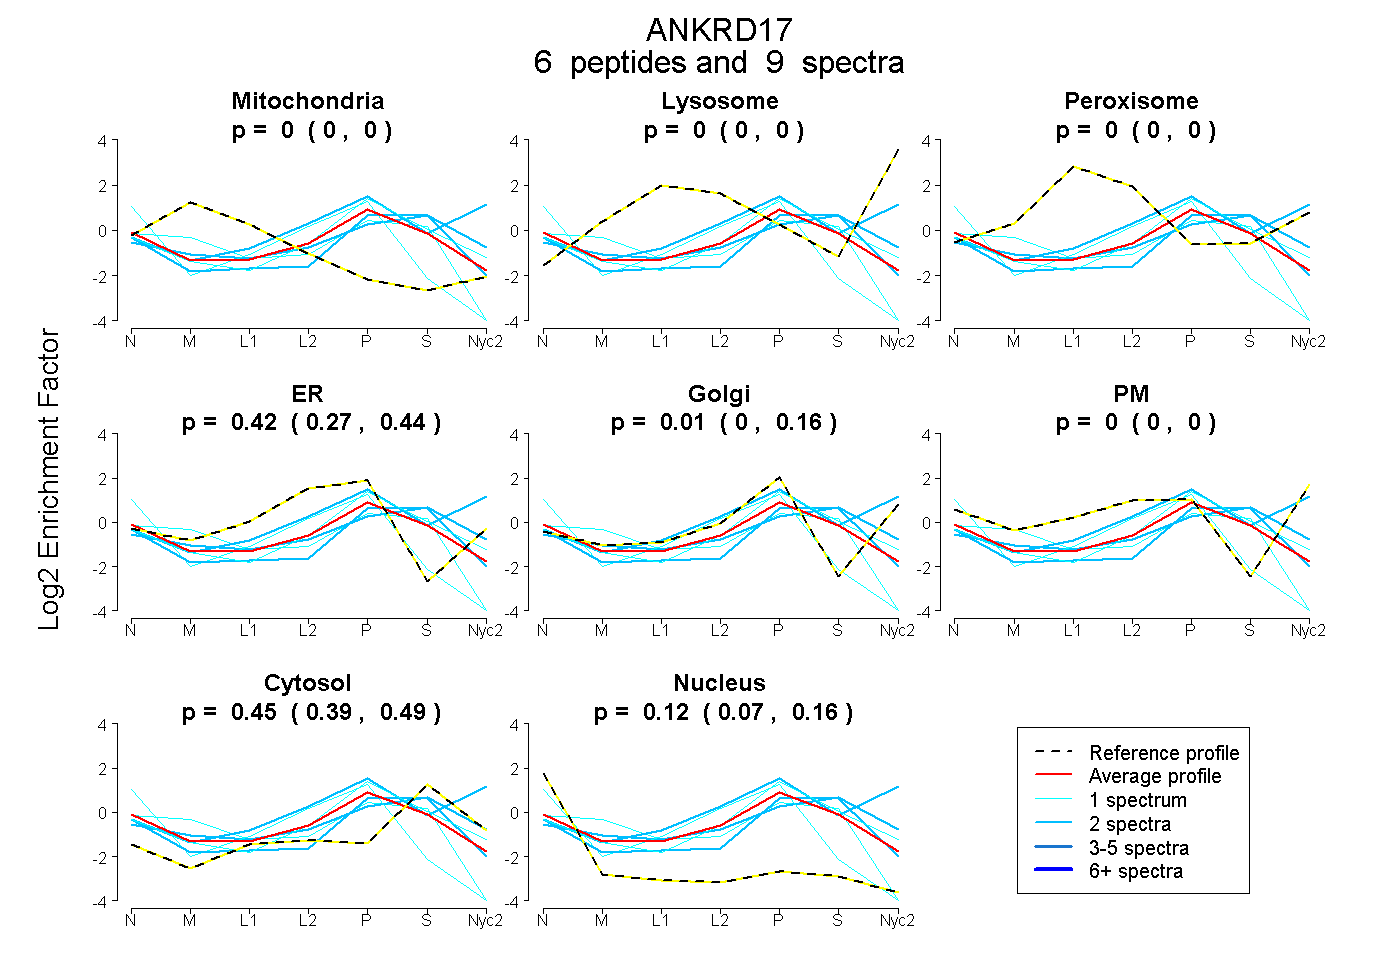
0.000 | 0.000
0.000 | 0.000
0.000 | 0.000
0.272 | 0.441
0.000 | 0.159
0.000 | 0.000
0.391 | 0.492
0.074 | 0.161
| Plot | Mito | Lyso | Perox | ER | Golgi | PM | Cytosol | Nucleus | |||||
| Expt A |
6 peptides |
9 spectra |
|
0.000 0.000 | 0.000 |
0.000 0.000 | 0.000 |
0.000 0.000 | 0.000 |
0.421 0.272 | 0.441 |
0.005 0.000 | 0.159 |
0.000 0.000 | 0.000 |
0.451 0.391 | 0.492 |
0.123 0.074 | 0.161 |
| 2 spectra, ITPLMAAFR | 0.000 | 0.157 | 0.000 | 0.000 | 0.509 | 0.048 | 0.285 | 0.000 | ||
| 1 spectrum, AGHVCTVQFLISK | 0.250 | 0.000 | 0.000 | 0.191 | 0.000 | 0.000 | 0.379 | 0.181 | ||
| 1 spectrum, QEVVELLLAR | 0.000 | 0.000 | 0.000 | 0.149 | 0.346 | 0.000 | 0.457 | 0.049 | ||
| 2 spectra, LLLAHK | 0.000 | 0.000 | 0.000 | 0.056 | 0.188 | 0.000 | 0.613 | 0.143 | ||
| 1 spectrum, LLEELEK | 0.000 | 0.000 | 0.000 | 0.579 | 0.000 | 0.000 | 0.000 | 0.421 | ||
| 2 spectra, GHLEMVR | 0.042 | 0.000 | 0.016 | 0.094 | 0.222 | 0.000 | 0.626 | 0.000 |
| Plot | Mito | Lyso or Perox | ER | Golgi | PM | Cytosol | Nucleus | ||||||
| Expt B |
2 peptides |
2 spectra |
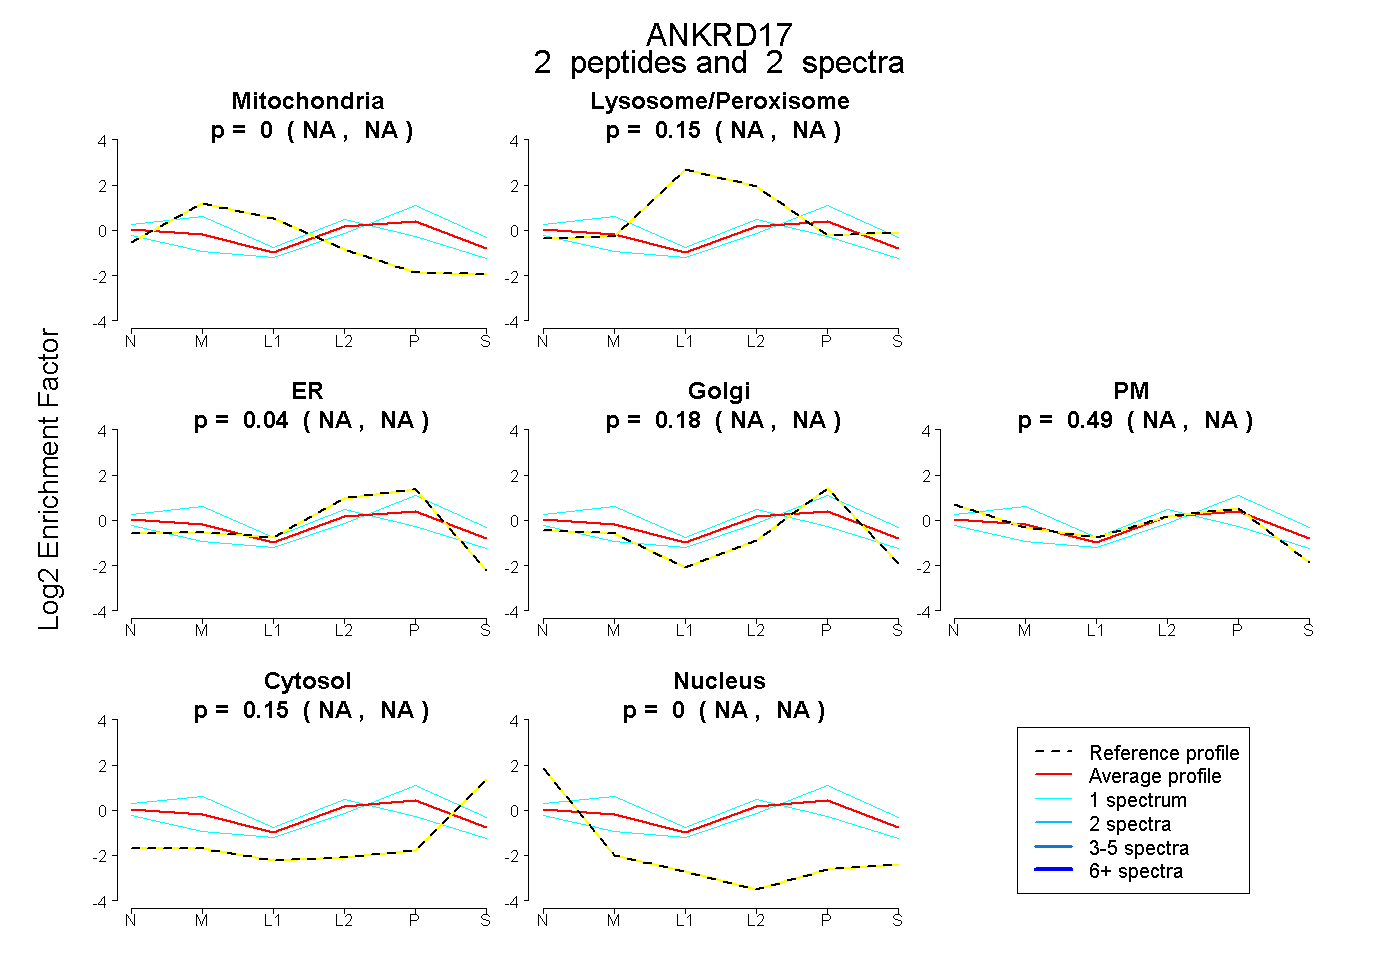 |
0.000 NA | NA |
0.149 NA | NA |
0.037 NA | NA |
0.179 NA | NA |
0.489 NA | NA |
0.146 NA | NA |
0.000 NA | NA |
|||
| Plot | Lyso | Other | |||||||||||
| Expt C |
3 peptides |
6 spectra |
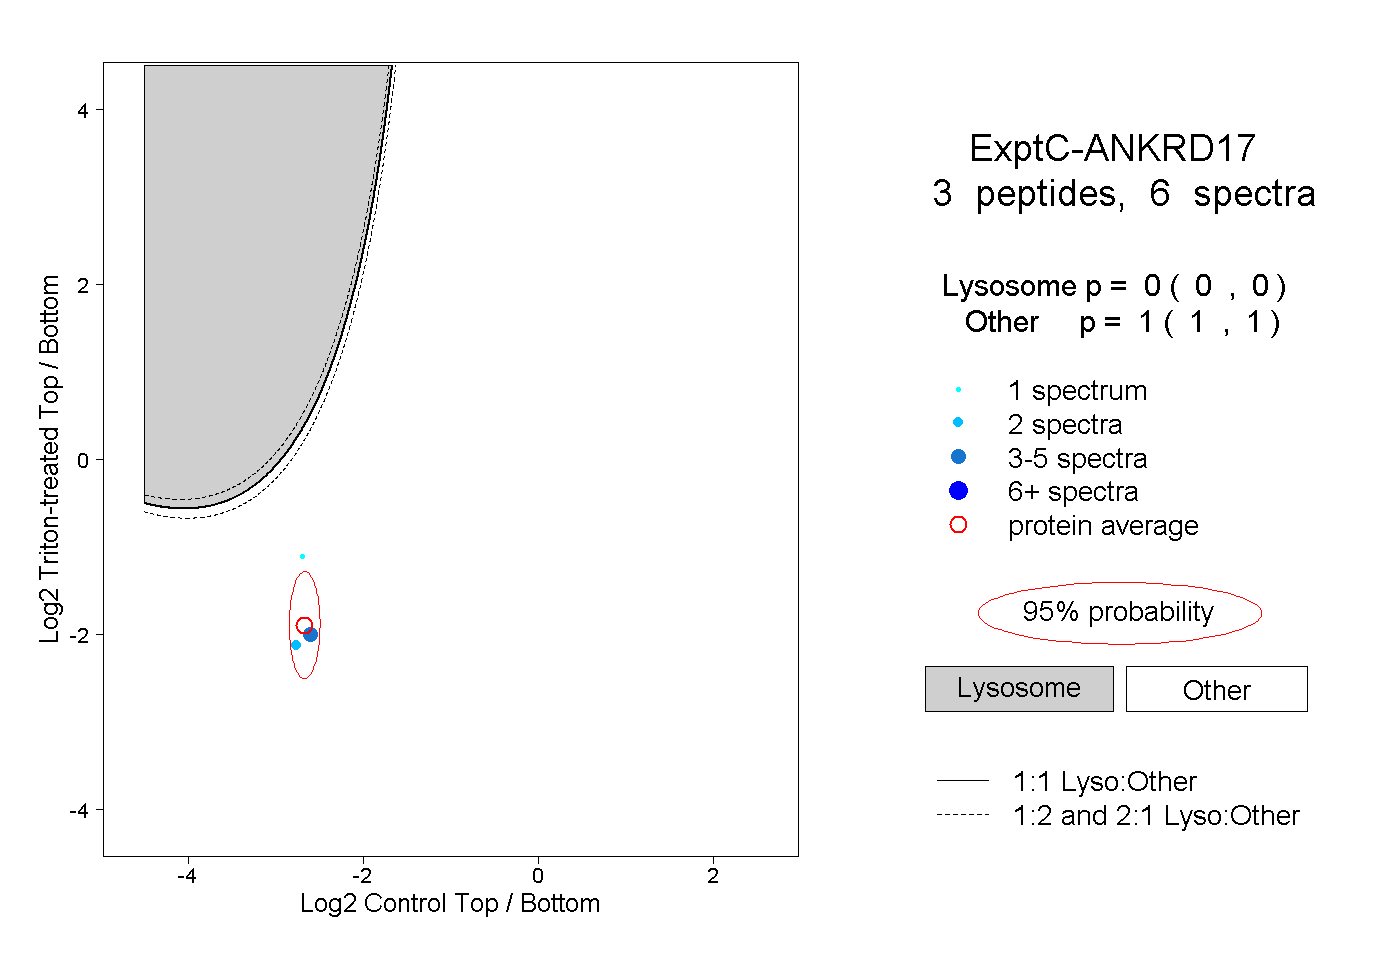 |
0.000 0.000 | 0.000 |
1.000 1.000 | 1.000 |