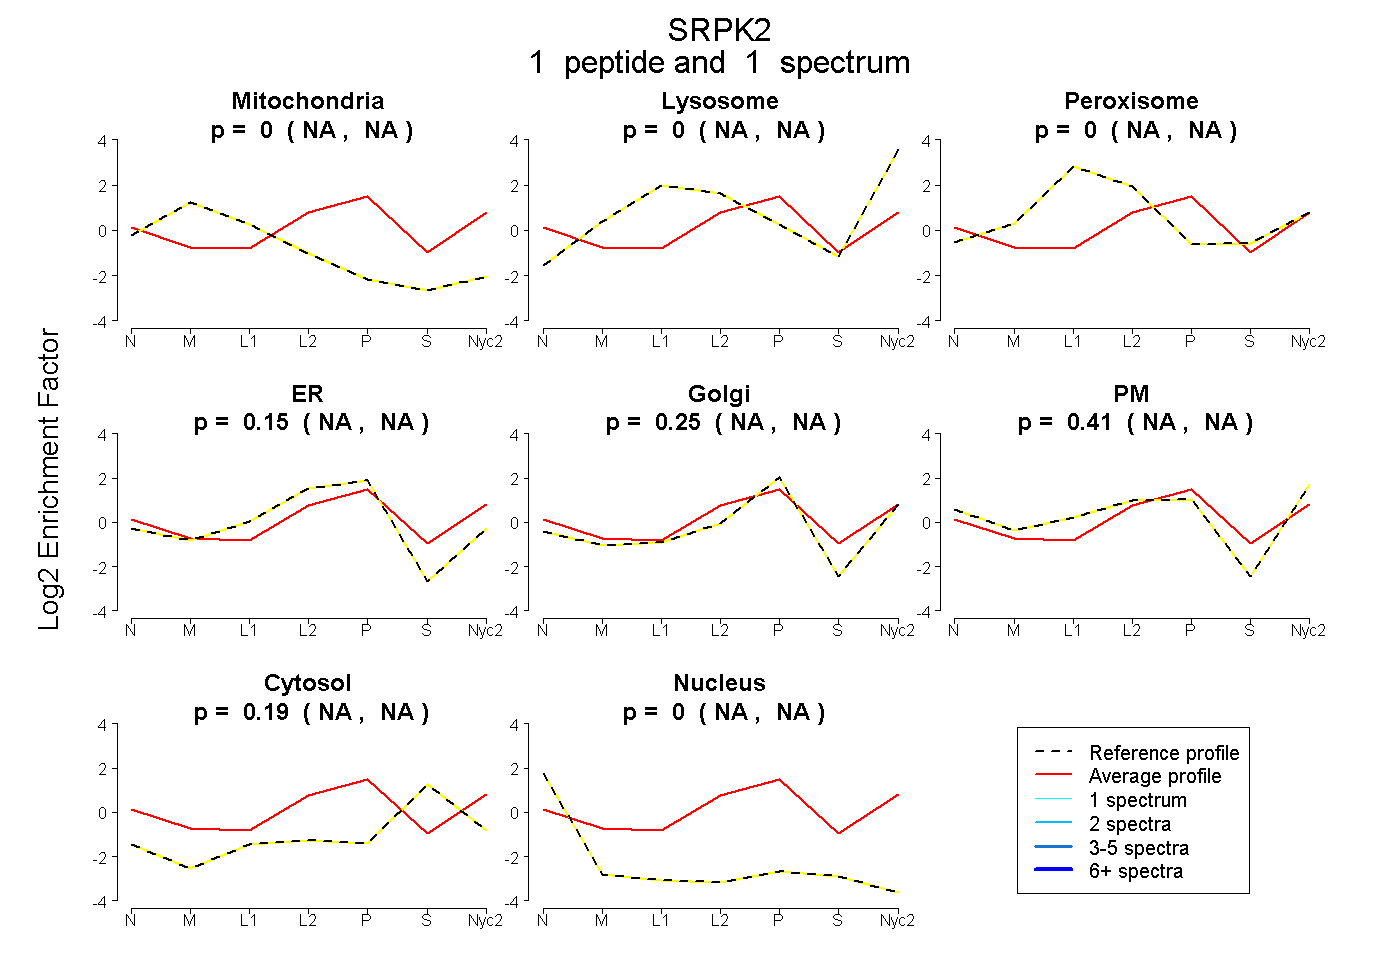
 1
1peptide
spectrum
NA | NA
NA | NA
NA | NA
NA | NA
NA | NA
NA | NA
NA | NA
NA | NA
| Plot | Mito | Lyso | Perox | ER | Golgi | PM | Cytosol | Nucleus | |||||
| Expt A |
1 peptide |
1 spectrum |
|
0.000 NA | NA |
0.000 NA | NA |
0.000 NA | NA |
0.151 NA | NA |
0.250 NA | NA |
0.409 NA | NA |
0.190 NA | NA |
0.000 NA | NA |
| 1 spectrum, HFALSGK | 0.000 | 0.000 | 0.000 | 0.151 | 0.250 | 0.409 | 0.190 | 0.000 |
| Plot | Lyso | Other | |||||||||||
| Expt C |
1 peptide |
1 spectrum |
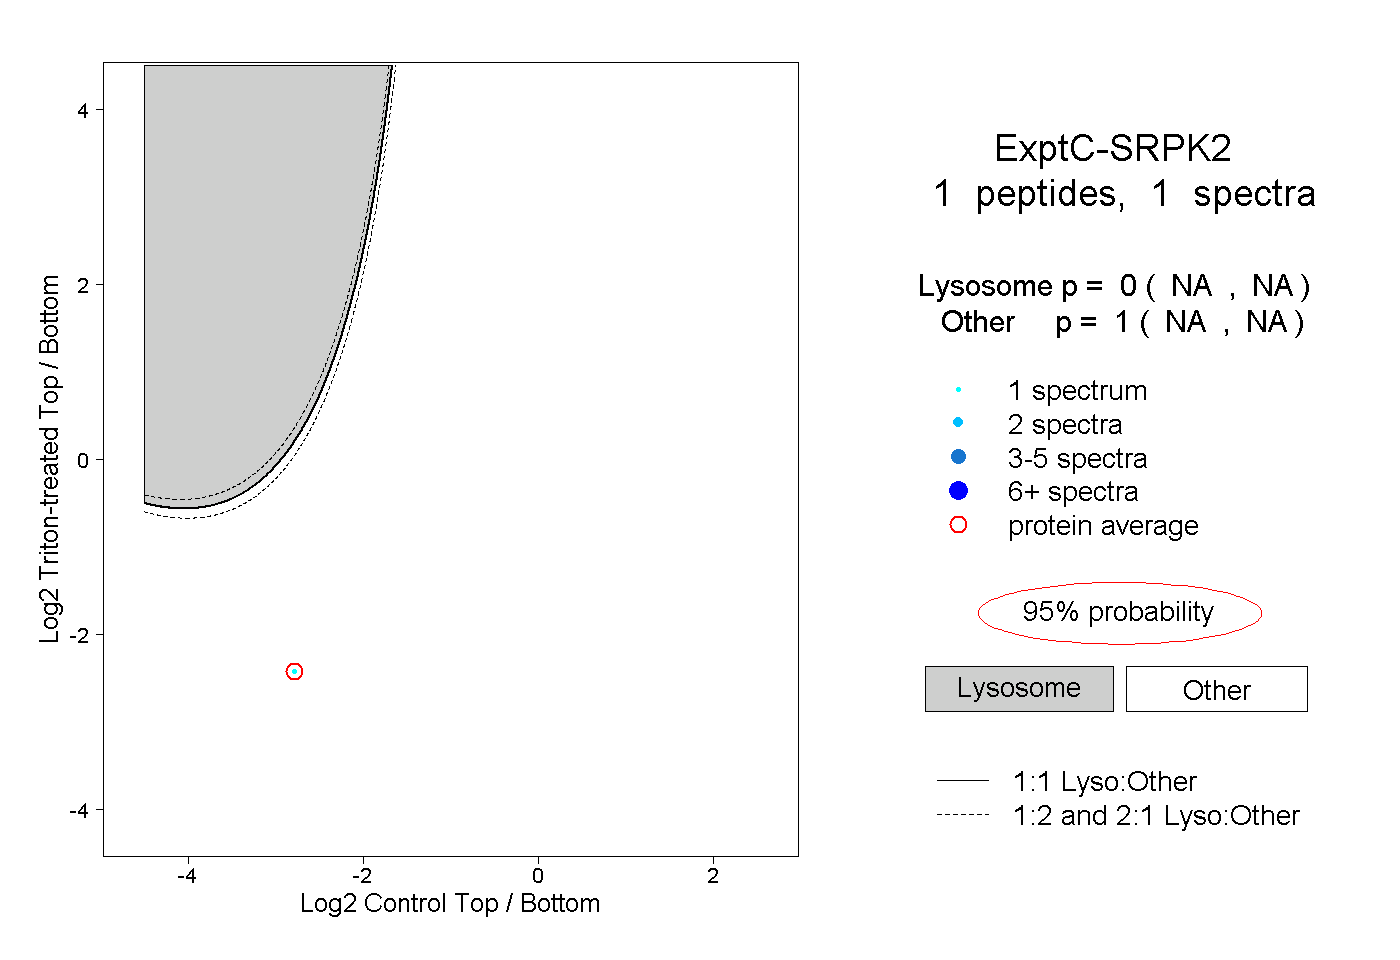 |
0.000 NA | NA |
1.000 NA | NA |