 3
3peptides
spectra
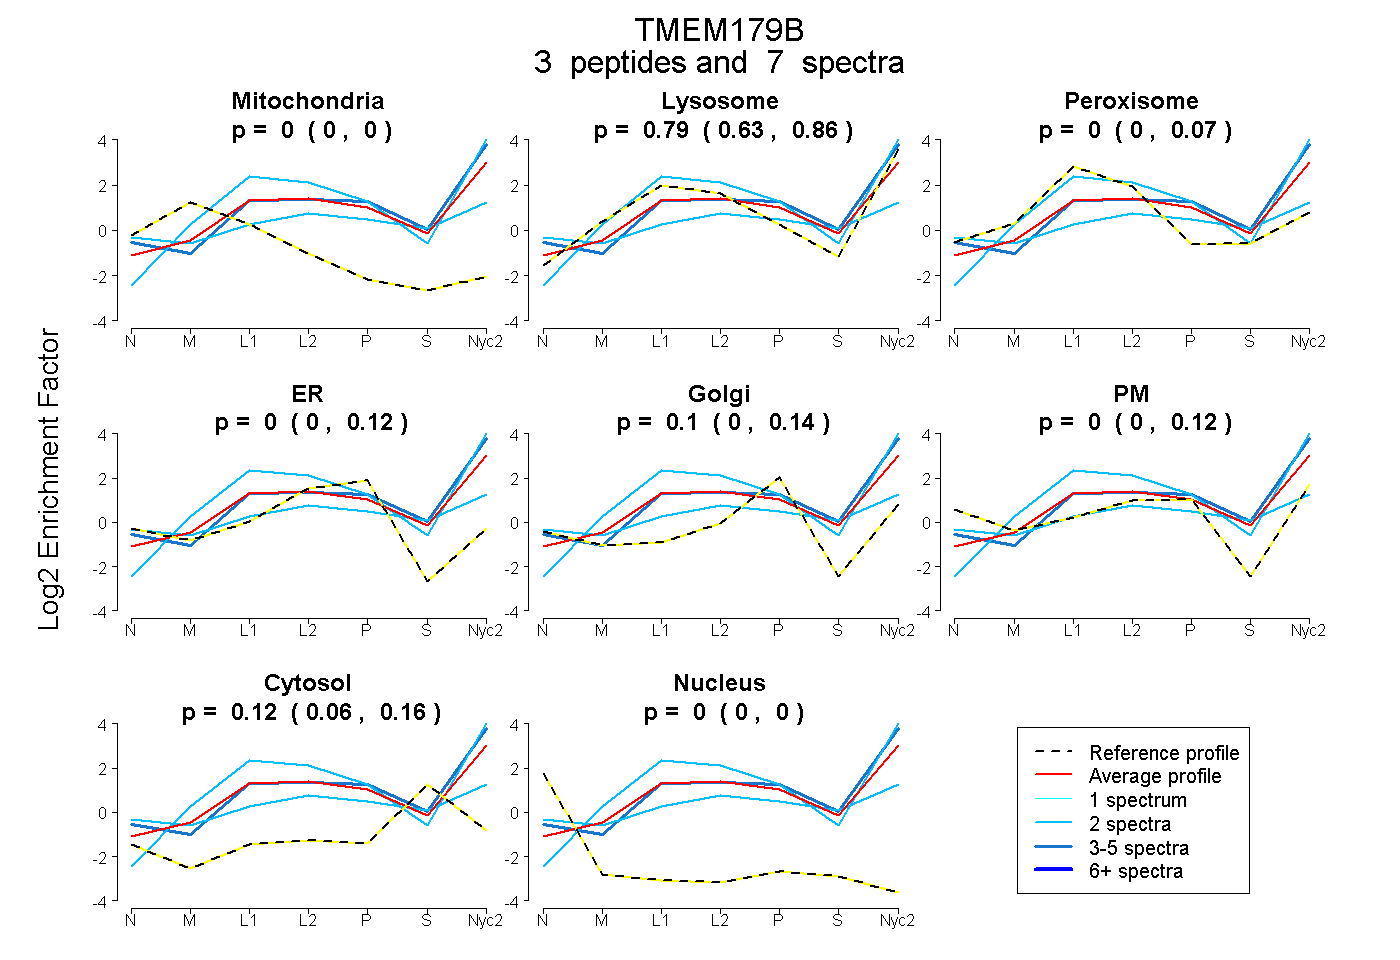
0.000 | 0.000
0.628 | 0.859
0.000 | 0.073
0.000 | 0.117
0.000 | 0.135
0.000 | 0.121
0.062 | 0.160
0.000 | 0.000
1peptide
spectrum
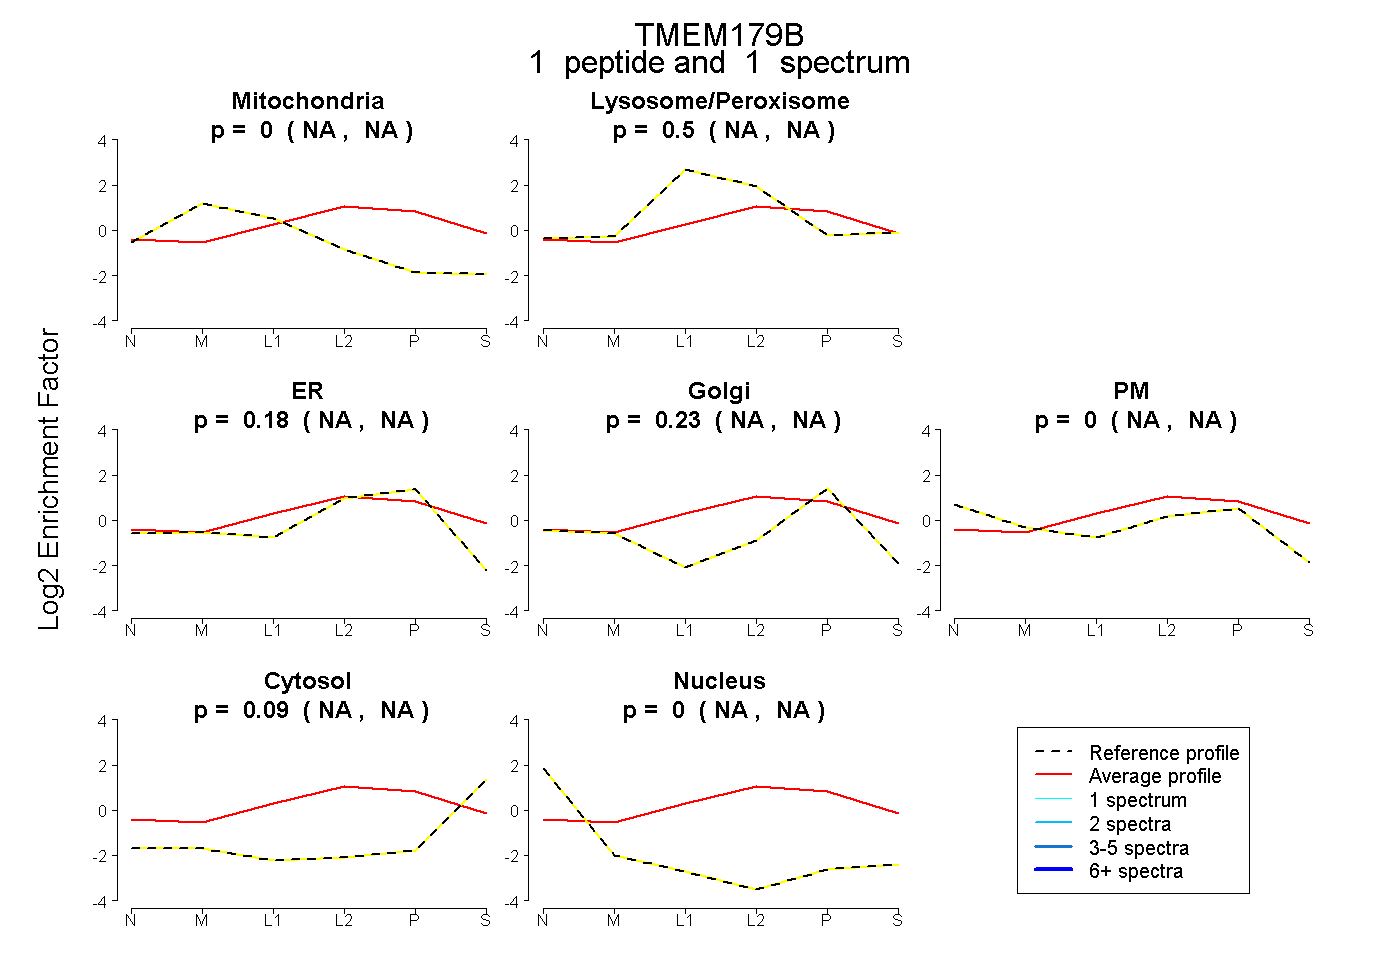
NA | NA
NA | NA
NA | NA
NA | NA
NA | NA
NA | NA
NA | NA
2peptides
spectra
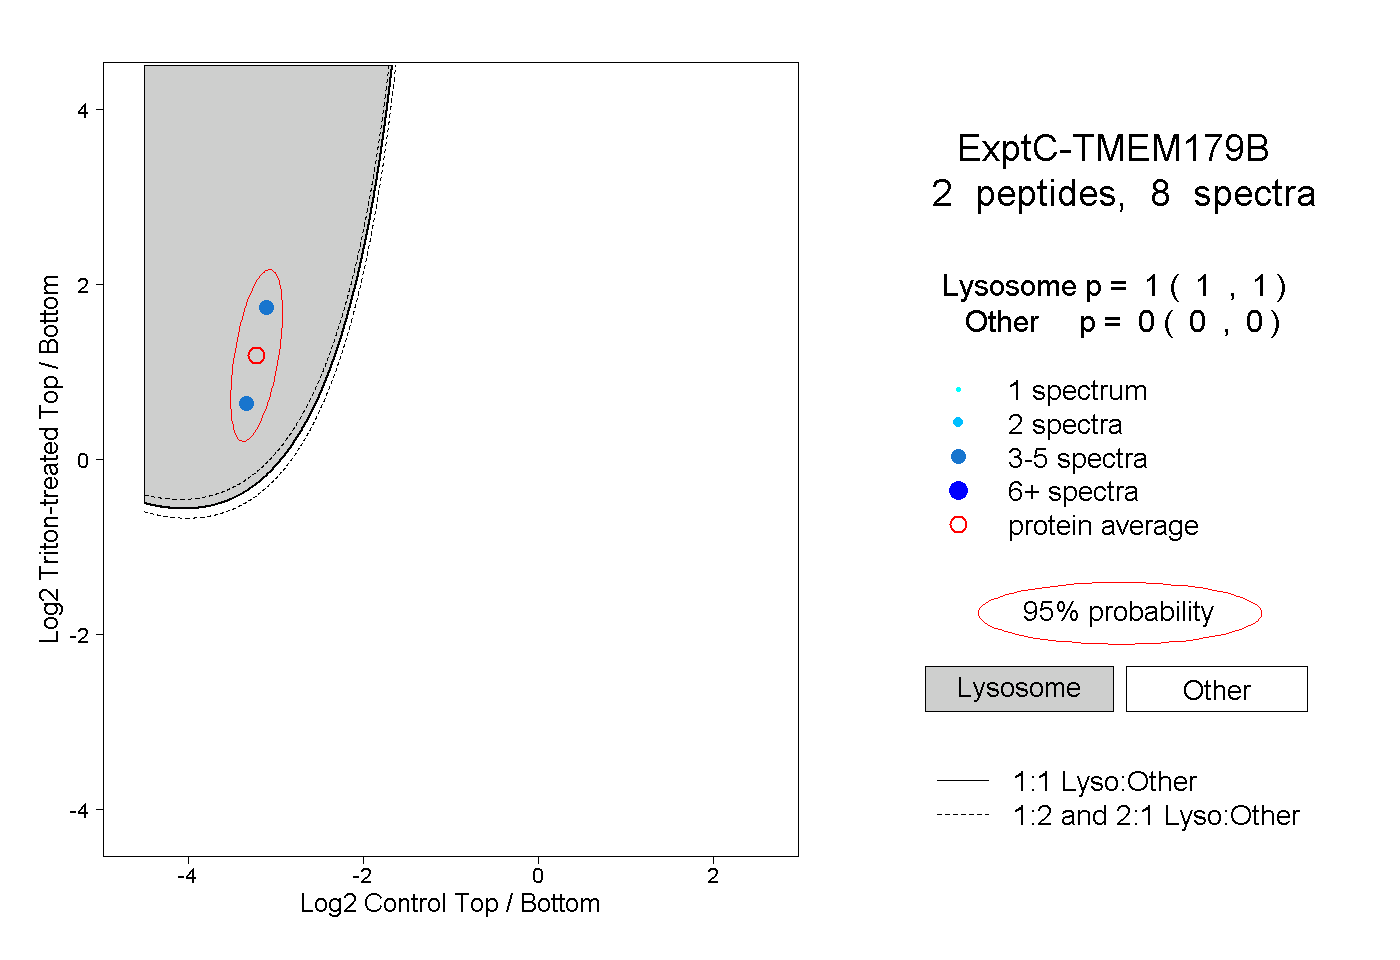
1.000 | 1.000
0.000 | 0.000