 2
2peptides
spectra
0.000 | 0.000
0.000 | 0.000
0.011 | 0.085
0.000 | 0.113
0.000 | 0.000
0.250 | 0.389
0.543 | 0.597
0.000 | 0.000
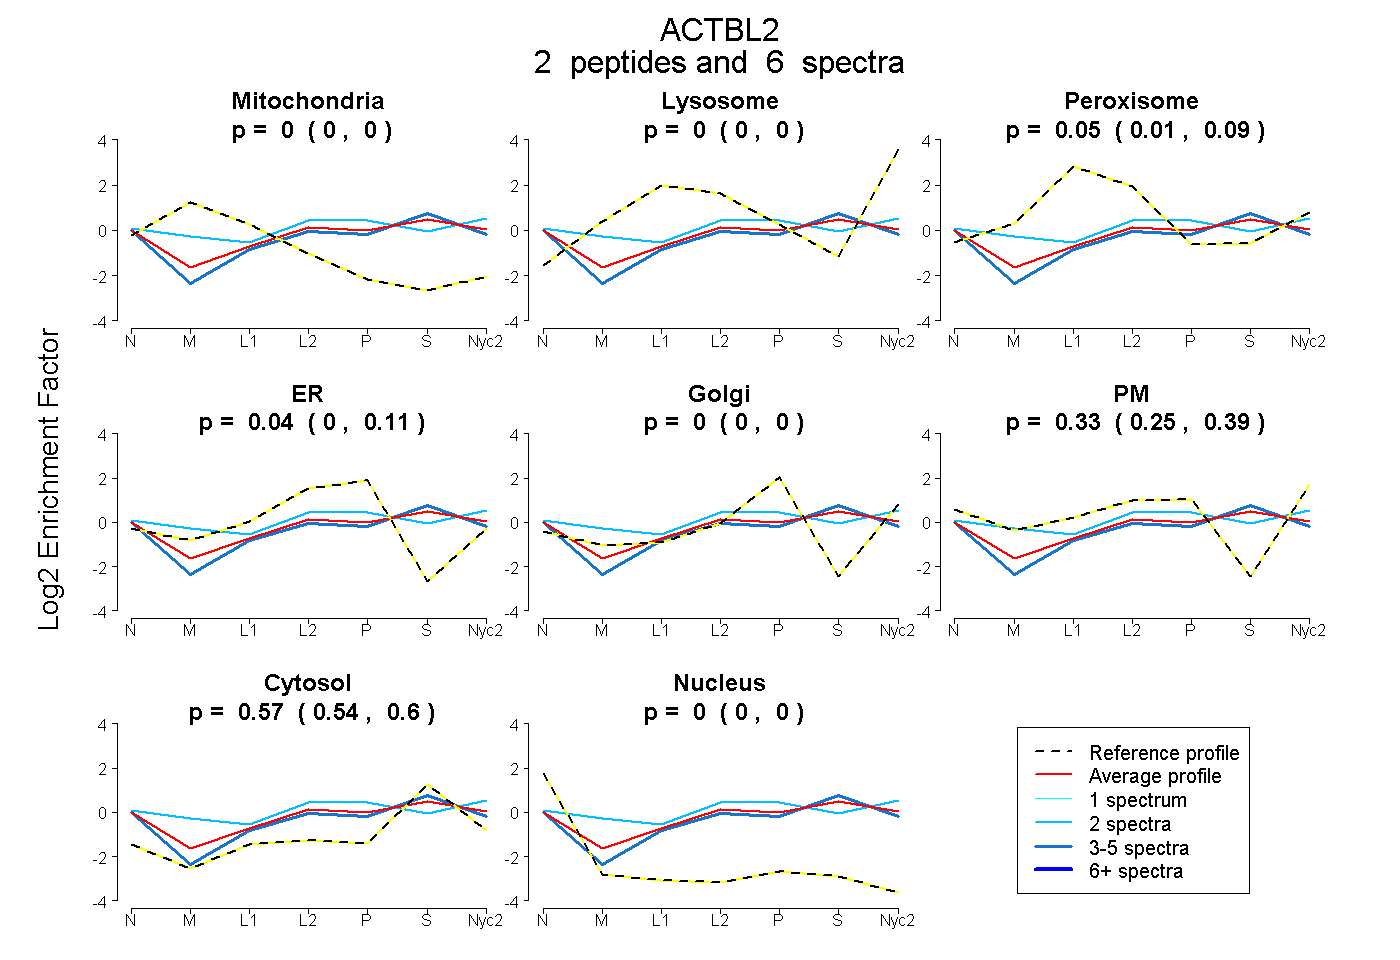
| Plot | Mito | Lyso | Perox | ER | Golgi | PM | Cytosol | Nucleus | |||||
| Expt A |
2 peptides |
6 spectra |
|
0.000 0.000 | 0.000 |
0.000 0.000 | 0.000 |
0.051 0.011 | 0.085 |
0.044 0.000 | 0.113 |
0.000 0.000 | 0.000 |
0.333 0.250 | 0.389 |
0.573 0.543 | 0.597 |
0.000 0.000 | 0.000 |
| 4 spectra, IWYHTFYNELR | 0.000 | 0.000 | 0.018 | 0.062 | 0.000 | 0.245 | 0.675 | 0.000 | ||
| 2 spectra, AGFGGDDAPR | 0.000 | 0.000 | 0.119 | 0.002 | 0.012 | 0.501 | 0.366 | 0.000 |
| Plot | Mito | Lyso or Perox | ER | Golgi | PM | Cytosol | Nucleus | ||||||
| Expt B |
1 peptide |
1 spectrum |
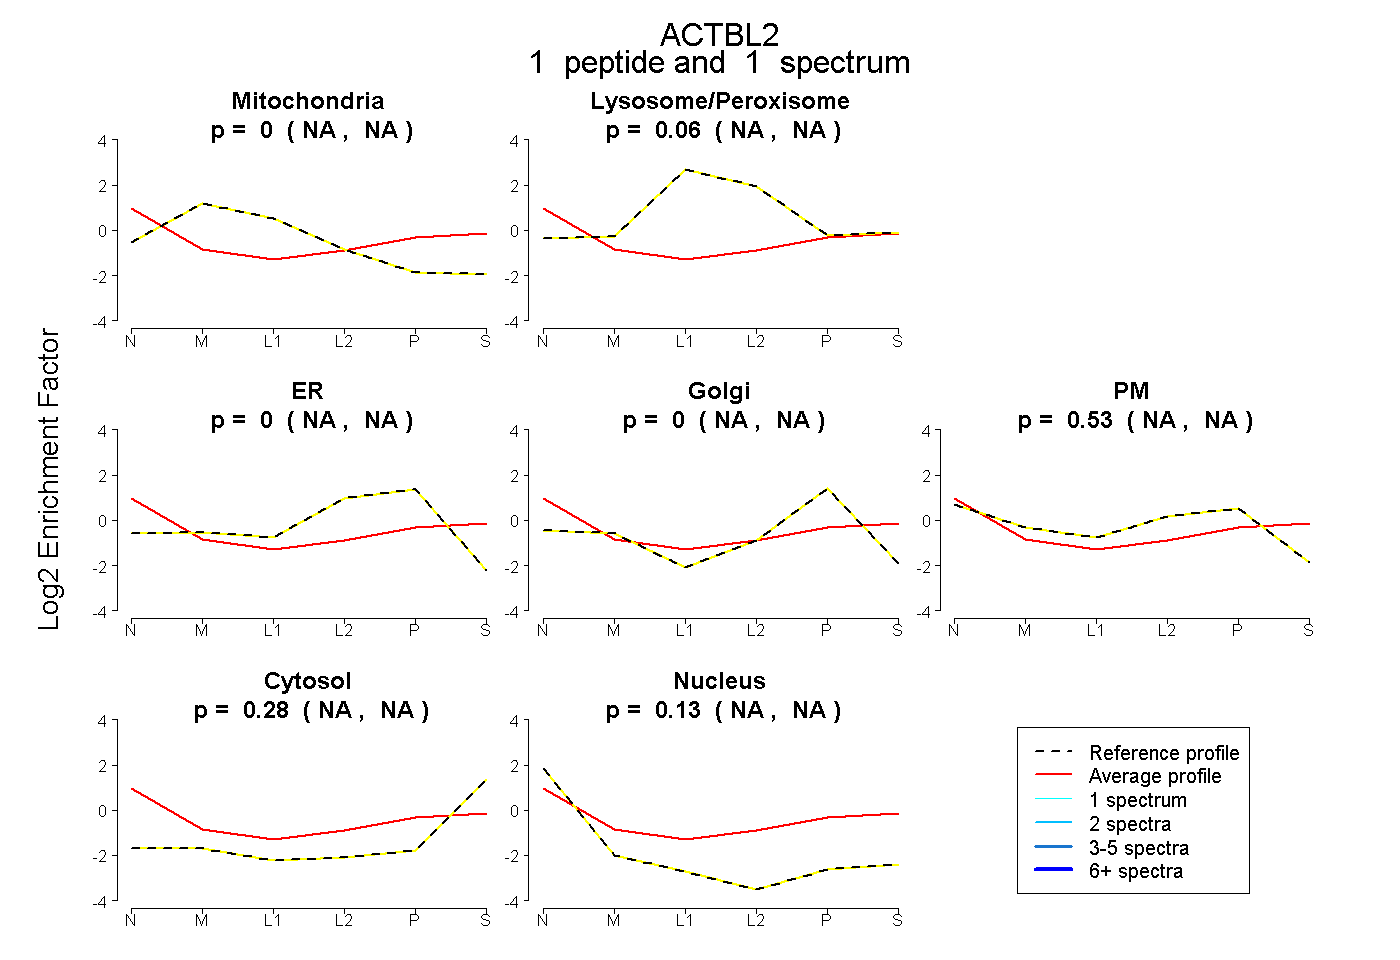 |
0.000 NA | NA |
0.061 NA | NA |
0.000 NA | NA |
0.000 NA | NA |
0.527 NA | NA |
0.284 NA | NA |
0.128 NA | NA |