 3
3peptides
spectra
0.000 | 0.222
0.000 | 0.000
0.000 | 0.085
0.000 | 0.137
0.000 | 0.092
0.000 | 0.000
0.638 | 0.753
0.000 | 0.154
1peptide
spectra

0.000 | 0.000
1.000 | 1.000
| Plot | Mito | Lyso | Perox | ER | Golgi | PM | Cytosol | Nucleus | |||||
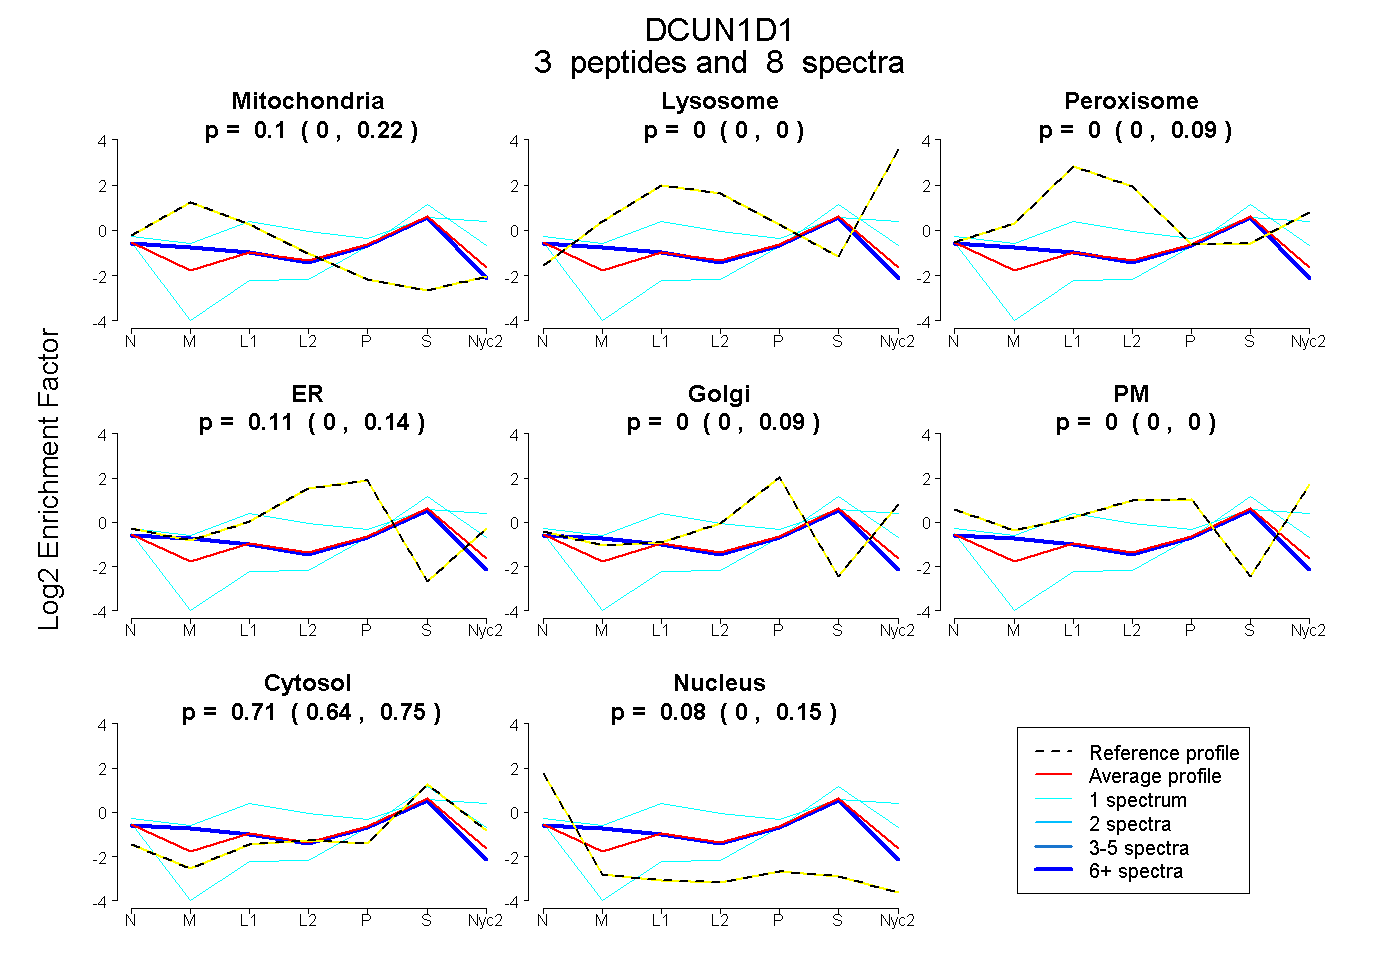
| Expt A |
3 peptides |
8 spectra |
|
0.098 0.000 | 0.222 |
0.000 0.000 | 0.000 |
0.000 0.000 | 0.085 |
0.114 0.000 | 0.137 |
0.000 0.000 | 0.092 |
0.000 0.000 | 0.000 |
0.714 0.638 | 0.753 |
0.075 0.000 | 0.154 |
||
| Plot | Lyso | Other | |||||||||||
| Expt C |
1 peptide |
3 spectra |
|
0.000 0.000 | 0.000 |
1.000 1.000 | 1.000 |