 1
1peptide
spectra
NA | NA
NA | NA
NA | NA
NA | NA
NA | NA
NA | NA
NA | NA
NA | NA
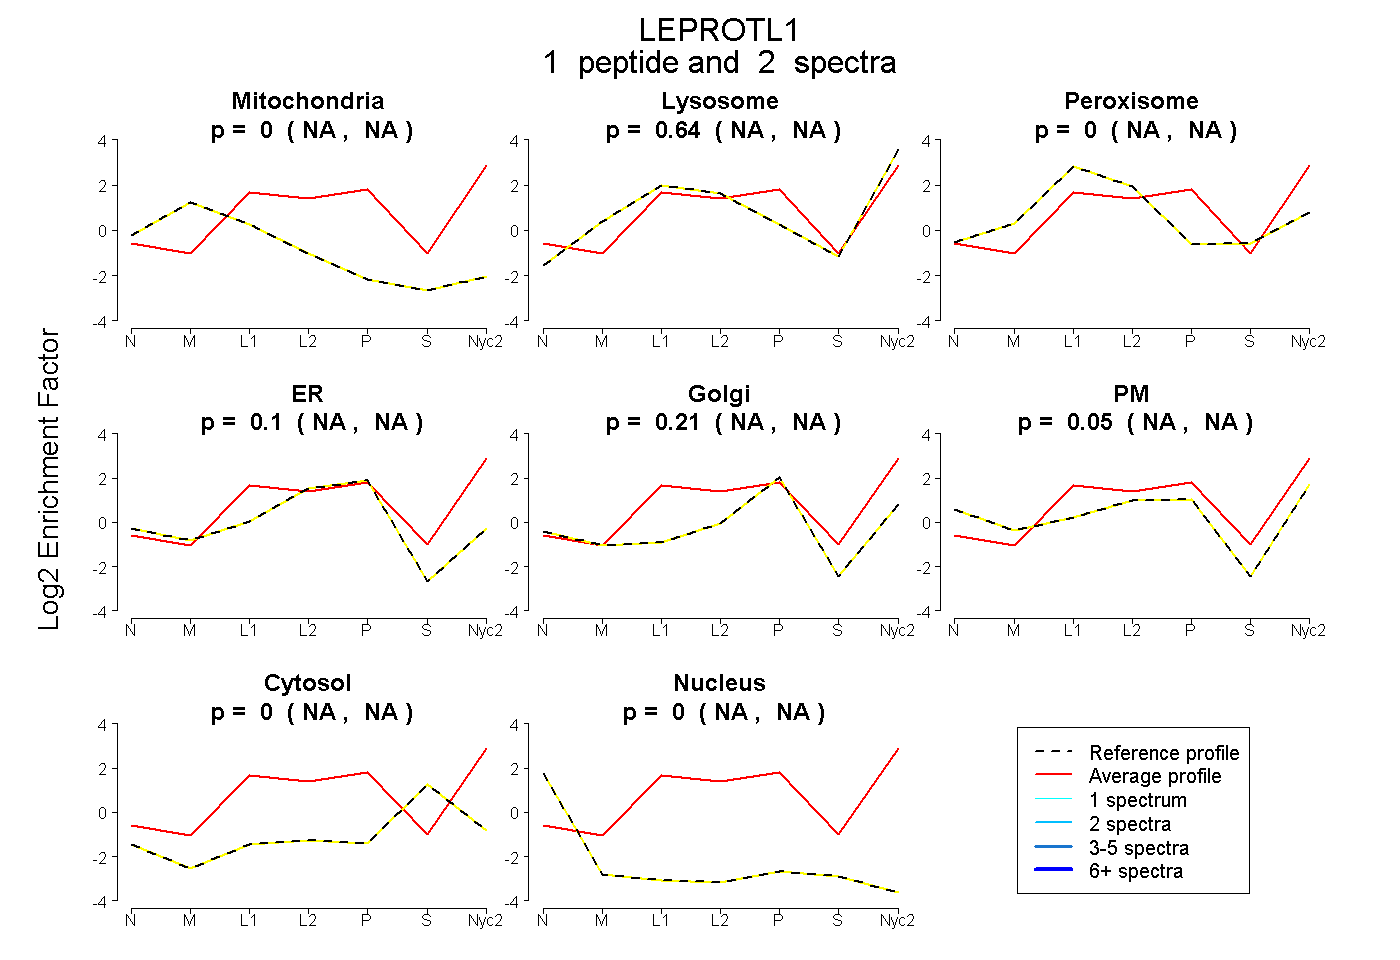
| Plot | Mito | Lyso | Perox | ER | Golgi | PM | Cytosol | Nucleus | |||||
| Expt A |
1 peptide |
2 spectra |
|
0.000 NA | NA |
0.645 NA | NA |
0.000 NA | NA |
0.095 NA | NA |
0.211 NA | NA |
0.050 NA | NA |
0.000 NA | NA |
0.000 NA | NA |
| 2 spectra, LVDDTDAMSNACK | 0.000 | 0.645 | 0.000 | 0.095 | 0.211 | 0.050 | 0.000 | 0.000 |
| Plot | Lyso | Other | |||||||||||
| Expt C |
1 peptide |
7 spectra |
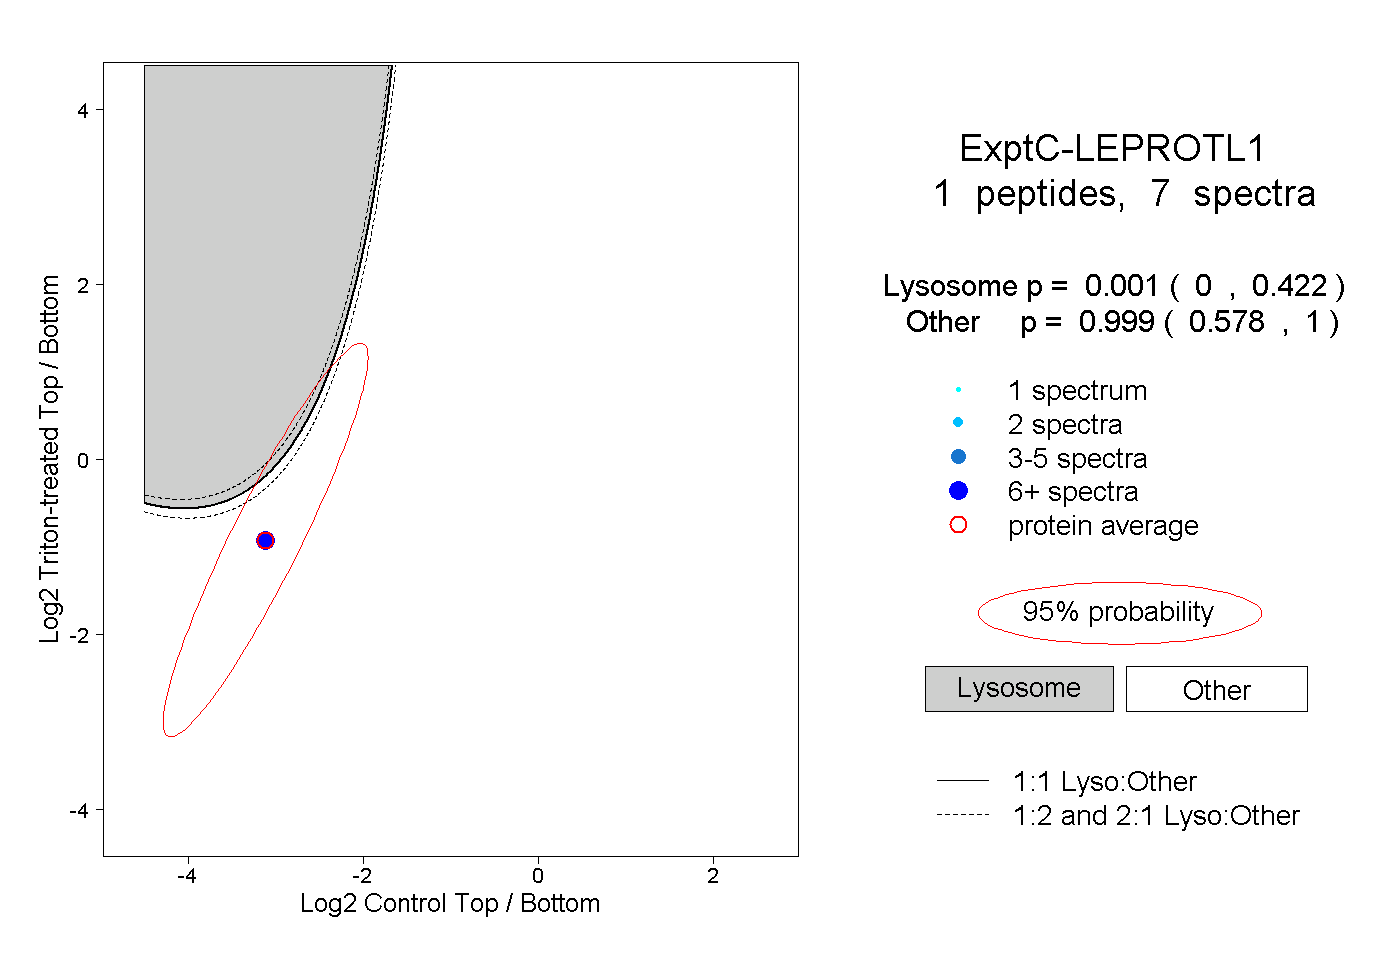 |
0.001 0.000 | 0.422 |
0.999 0.578 | 1.000 |