 5
5peptides
spectra
0.000 | 0.000
0.000 | 0.000
0.000 | 0.000
0.000 | 0.000
0.000 | 0.000
0.000 | 0.000
0.902 | 0.938
0.058 | 0.095
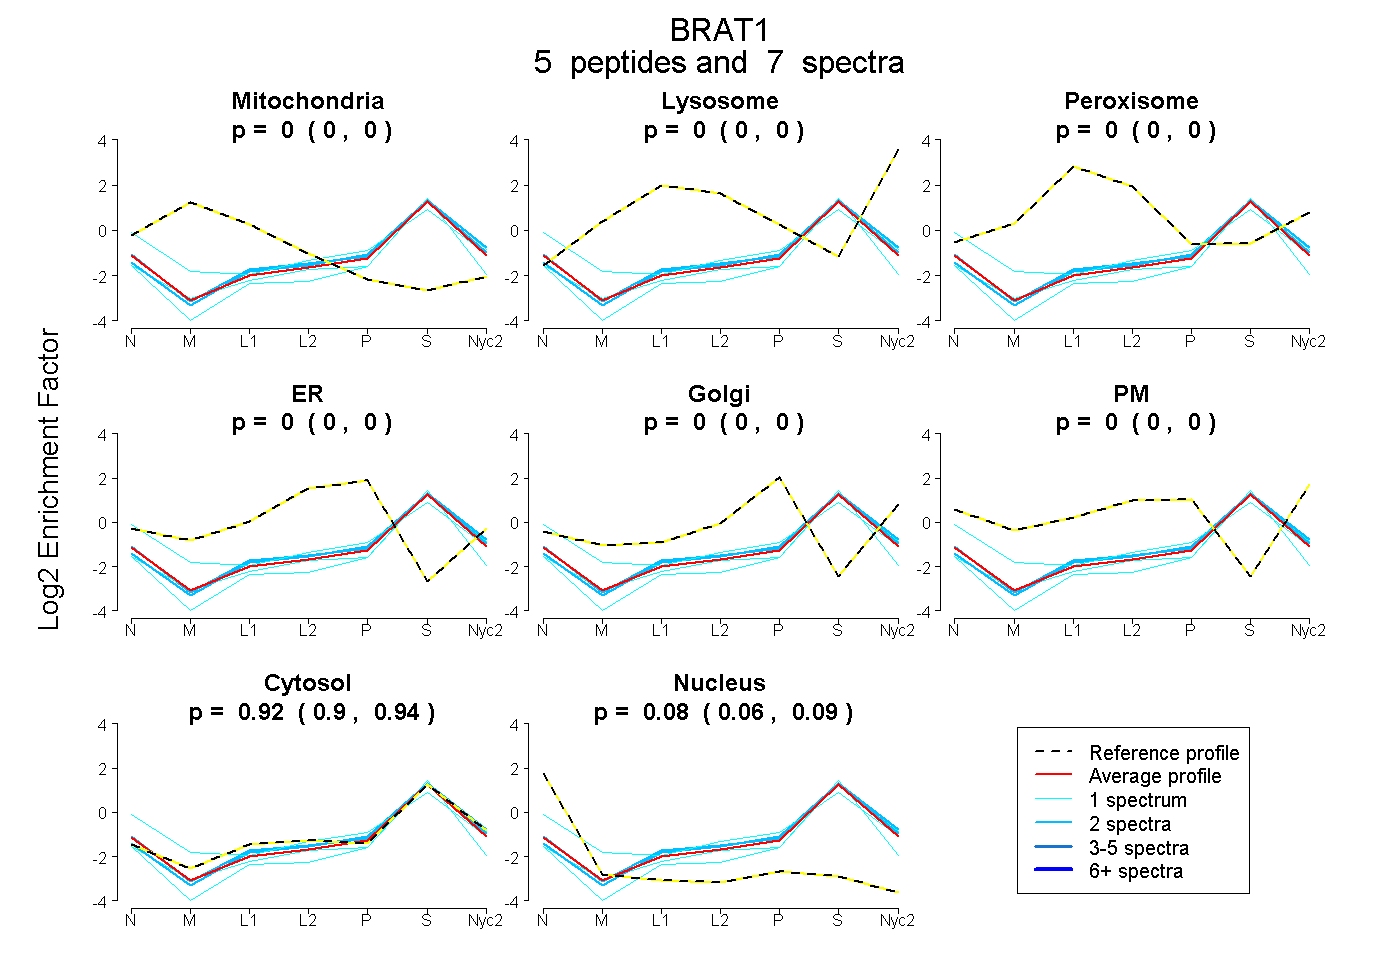
| Plot | Mito | Lyso | Perox | ER | Golgi | PM | Cytosol | Nucleus | |||||
| Expt A |
5 peptides |
7 spectra |
|
0.000 0.000 | 0.000 |
0.000 0.000 | 0.000 |
0.000 0.000 | 0.000 |
0.000 0.000 | 0.000 |
0.000 0.000 | 0.000 |
0.000 0.000 | 0.000 |
0.923 0.902 | 0.938 |
0.077 0.058 | 0.095 |
| 2 spectra, DSALEFLTHLIR | 0.000 | 0.000 | 0.000 | 0.000 | 0.000 | 0.000 | 0.951 | 0.049 | ||
| 2 spectra, SLDLEGLQGR | 0.000 | 0.000 | 0.000 | 0.000 | 0.000 | 0.000 | 0.989 | 0.011 | ||
| 1 spectrum, LSDGSADPSSSAGGR | 0.000 | 0.000 | 0.000 | 0.000 | 0.000 | 0.000 | 0.958 | 0.042 | ||
| 1 spectrum, ACDLLLFLR | 0.000 | 0.000 | 0.000 | 0.000 | 0.000 | 0.000 | 0.860 | 0.140 | ||
| 1 spectrum, VFTEWLR | 0.000 | 0.000 | 0.000 | 0.000 | 0.013 | 0.097 | 0.749 | 0.142 |