 3
3peptides
spectra
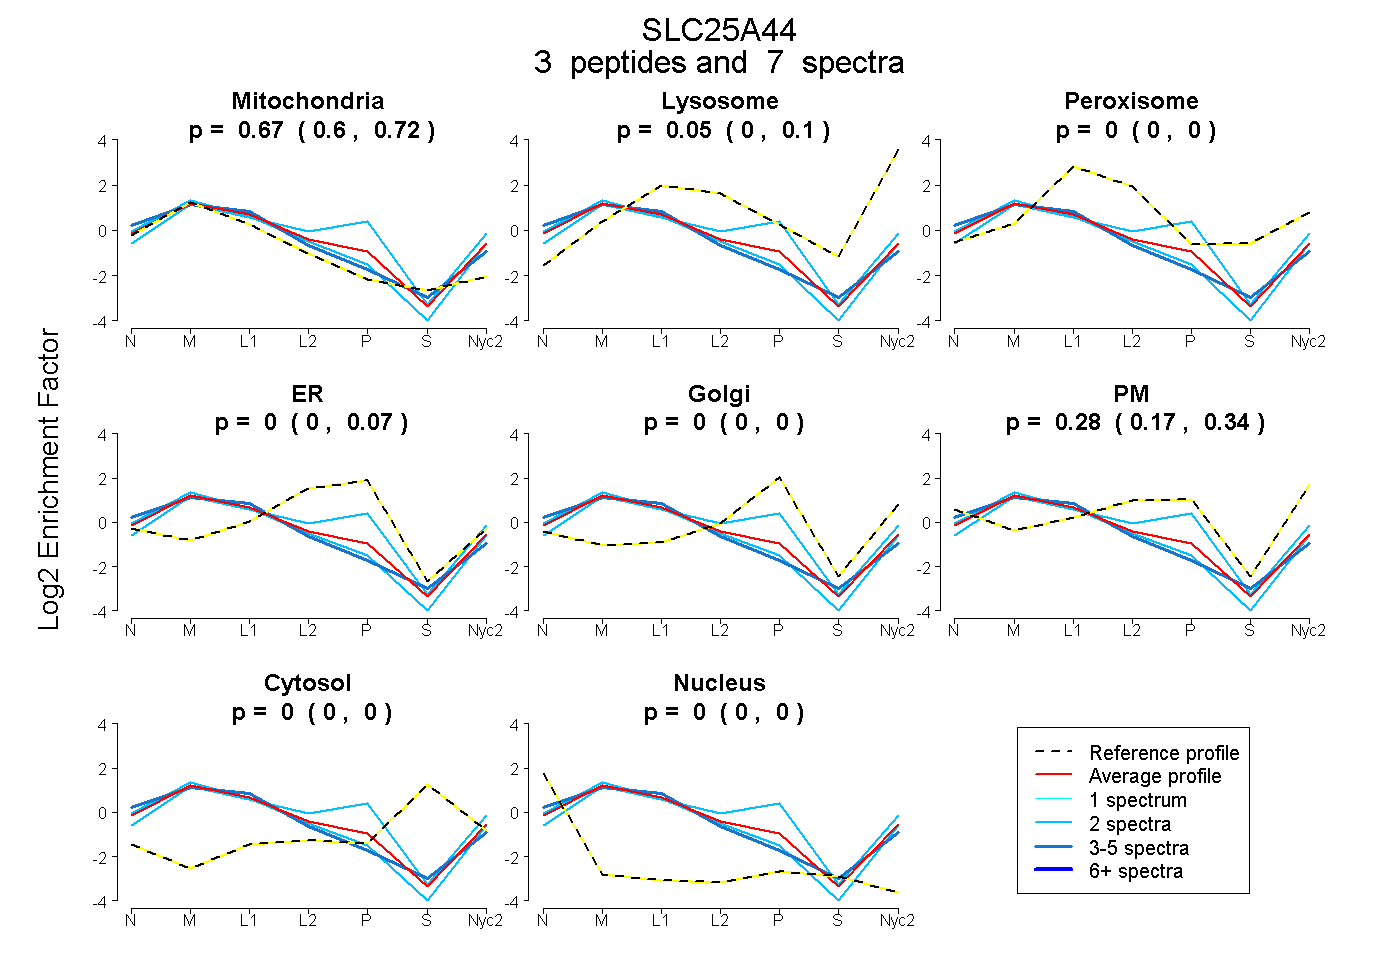
0.601 | 0.717
0.002 | 0.101
0.000 | 0.000
0.000 | 0.069
0.000 | 0.000
0.169 | 0.337
0.000 | 0.000
0.000 | 0.000
2peptides
spectra
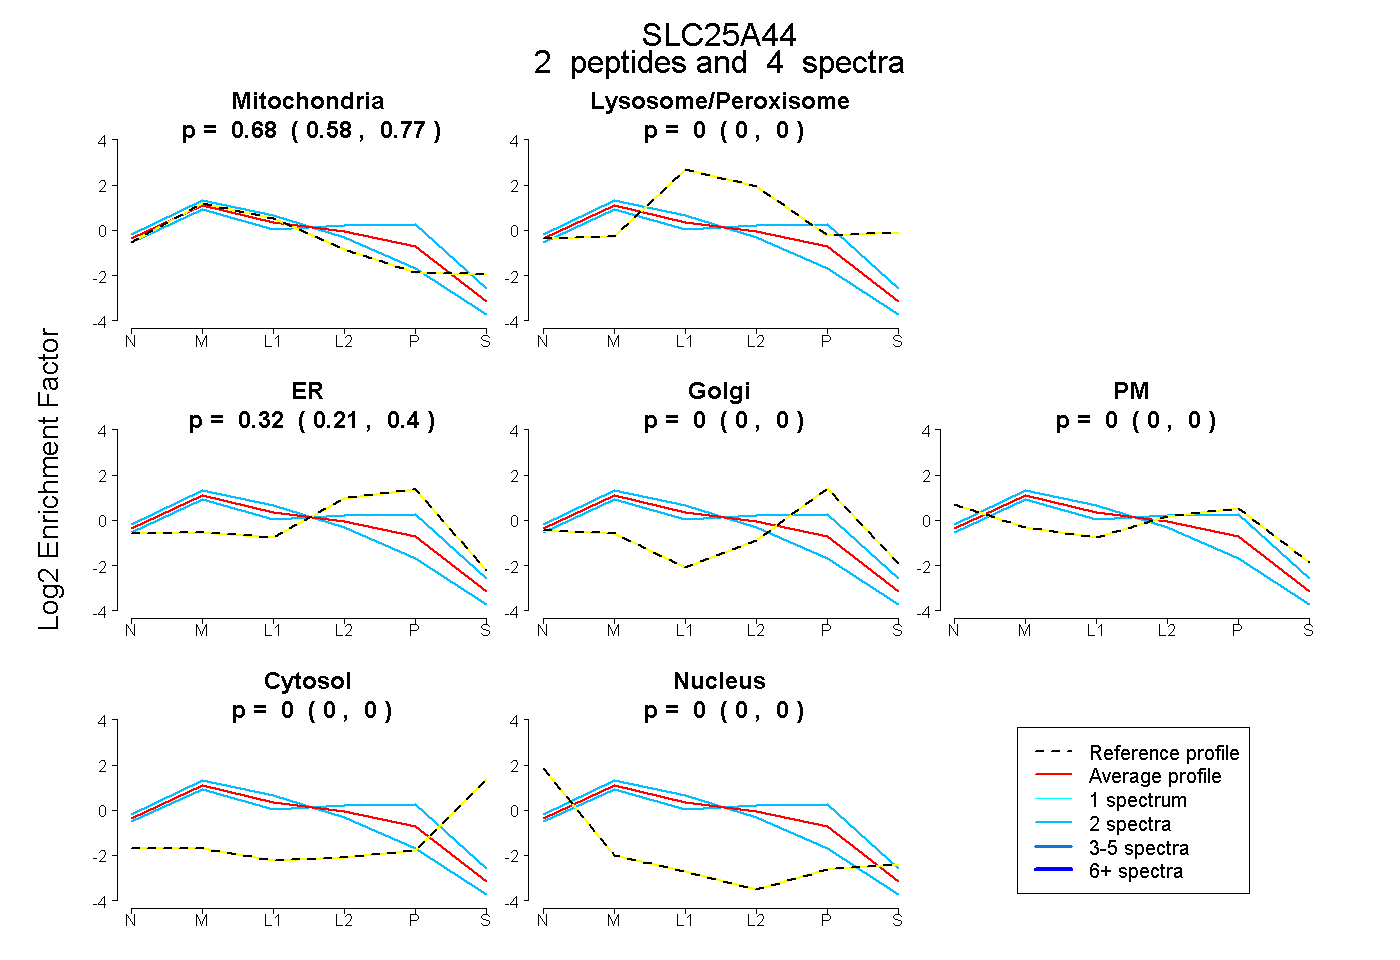
0.582 | 0.770
0.000 | 0.000
0.210 | 0.399
0.000 | 0.000
0.000 | 0.000
0.000 | 0.000
0.000 | 0.000
9peptides
spectra
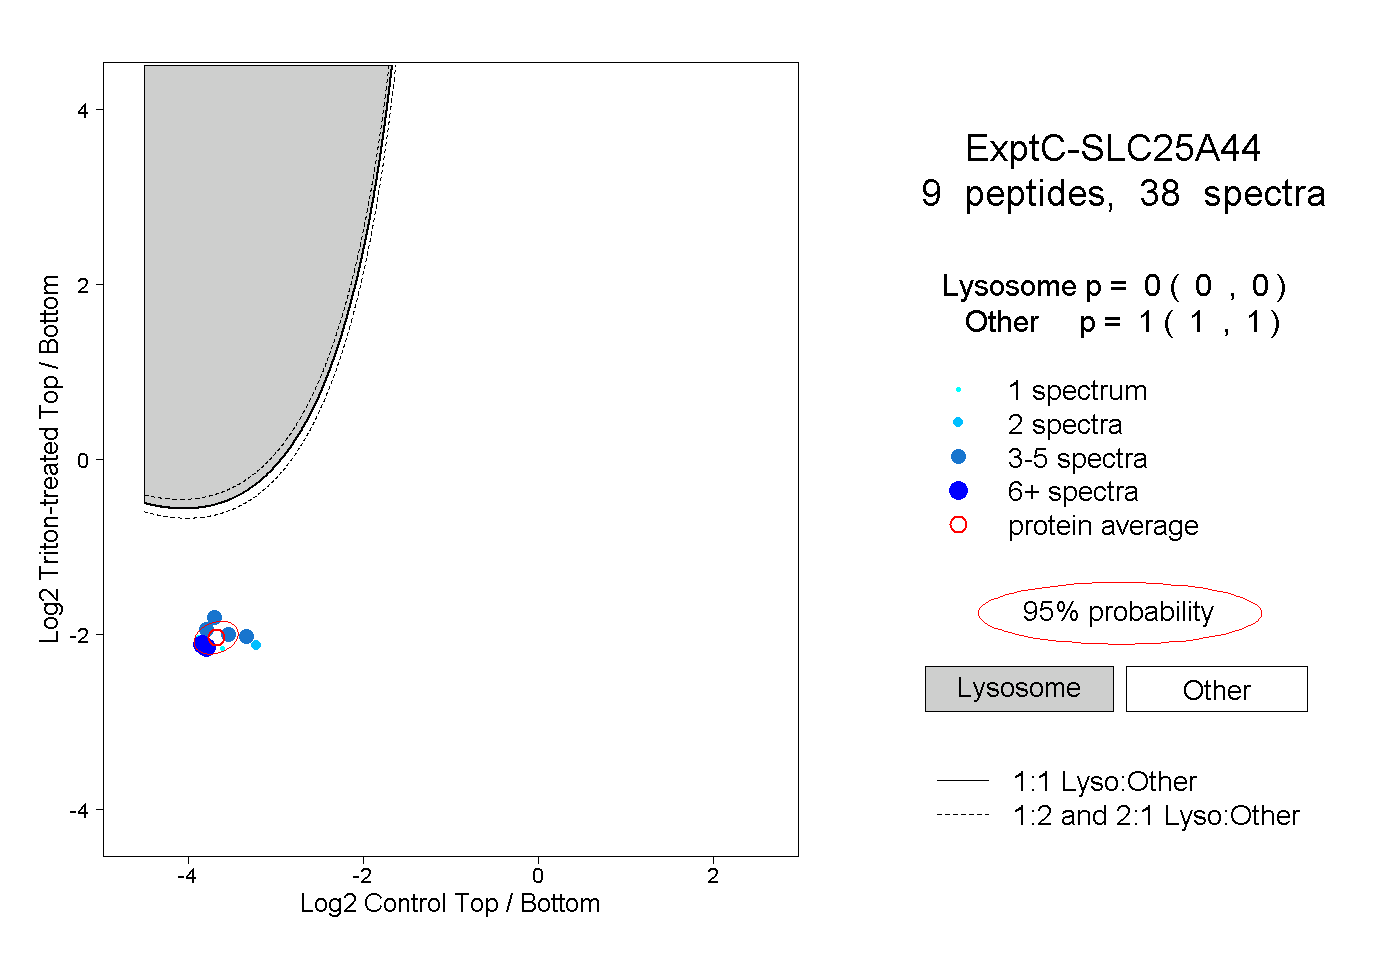
0.000 | 0.000
1.000 | 1.000