SYNJ2
[ENSRNOP00000059744]
Main page
| | | Plot |
Mito |
Lyso |
|
Perox |
ER |
Golgi |
PM |
Cytosol |
Nucleus |
|
| Expt A |
 1
1
peptide |
1
spectrum |
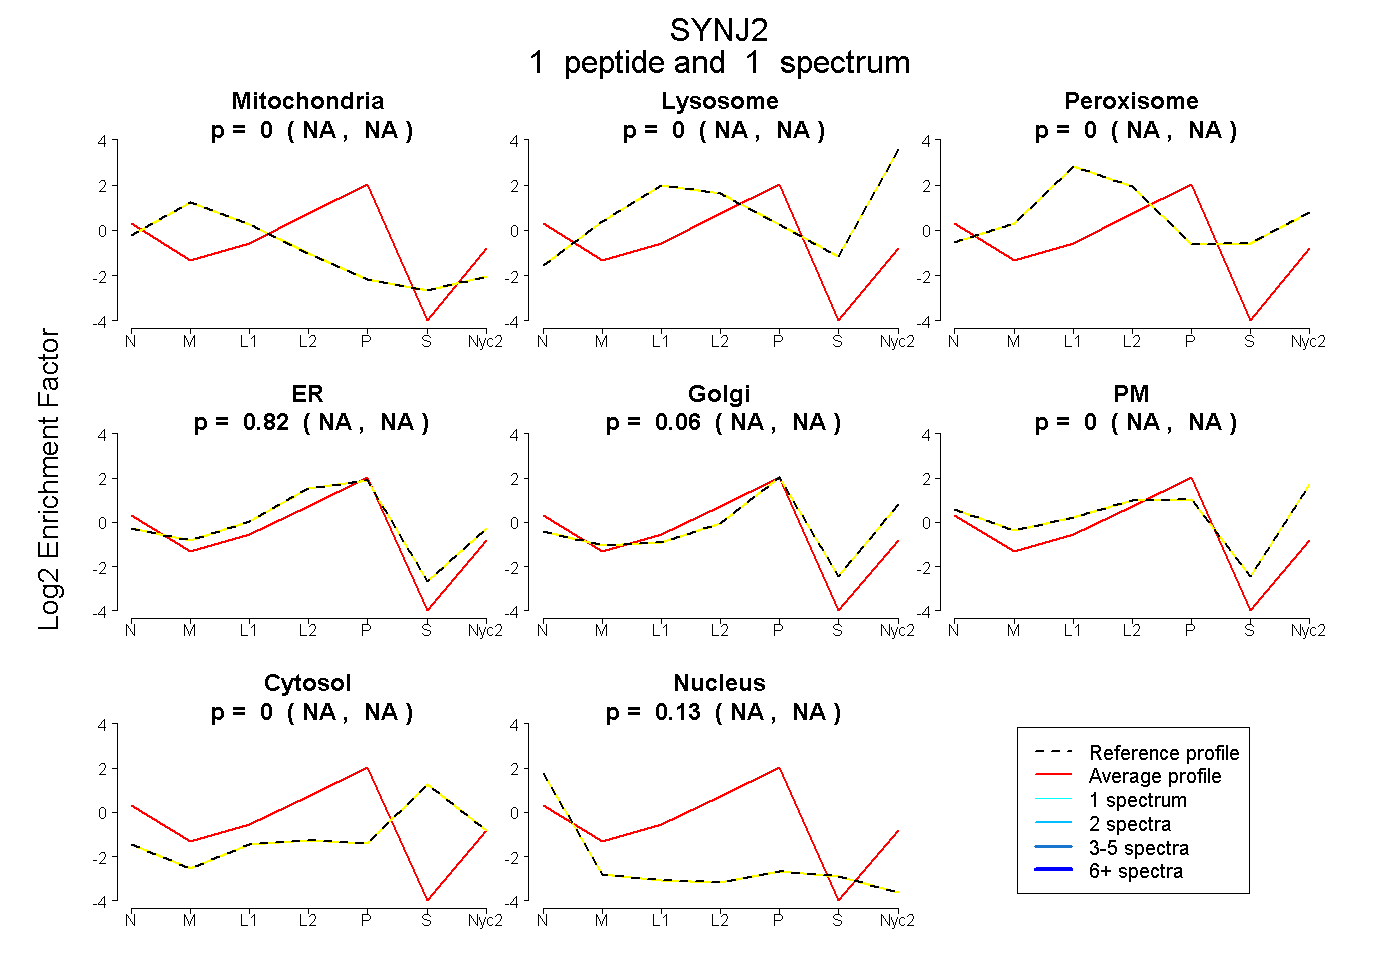 |
0.000
NA | NA |
0.000
NA | NA |
|
0.000
NA | NA |
0.818
NA | NA |
0.055
NA | NA |
0.000
NA | NA |
0.000
NA | NA |
0.126
NA | NA |
|
| | | Plot |
Mito |
|
Lyso or Perox |
|
ER |
Golgi |
PM |
Cytosol |
Nucleus |
|
| Expt B |
1
peptide |
1
spectrum |
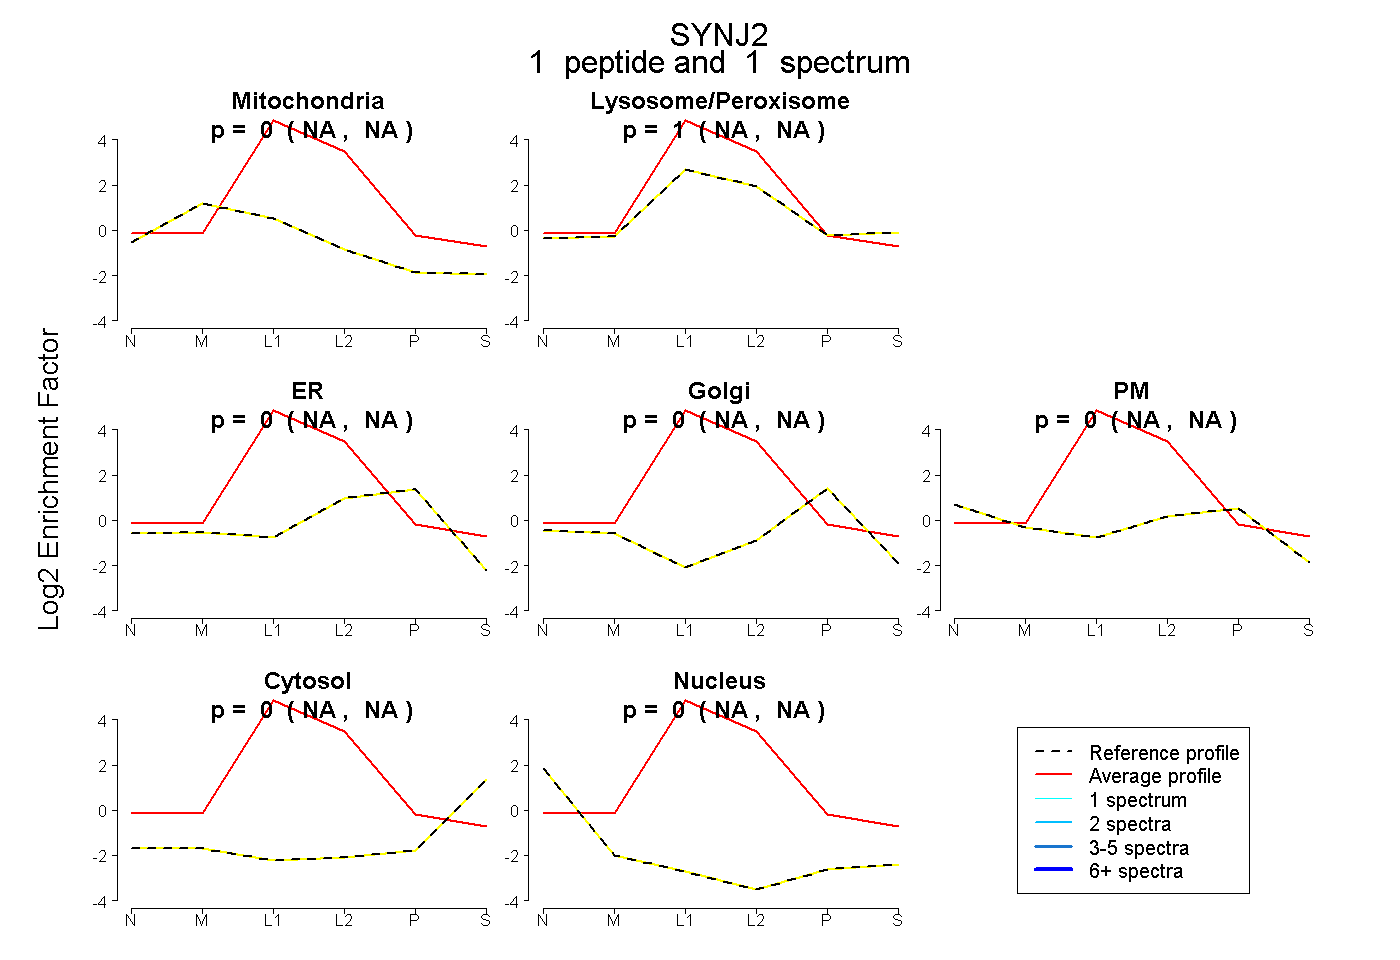 |
0.000
NA | NA |
|
1.000
NA | NA |
|
0.000
NA | NA |
0.000
NA | NA |
0.000
NA | NA |
0.000
NA | NA |
0.000
NA | NA |
|
| | | Plot |
|
Lyso |
|
|
|
|
|
|
|
Other |
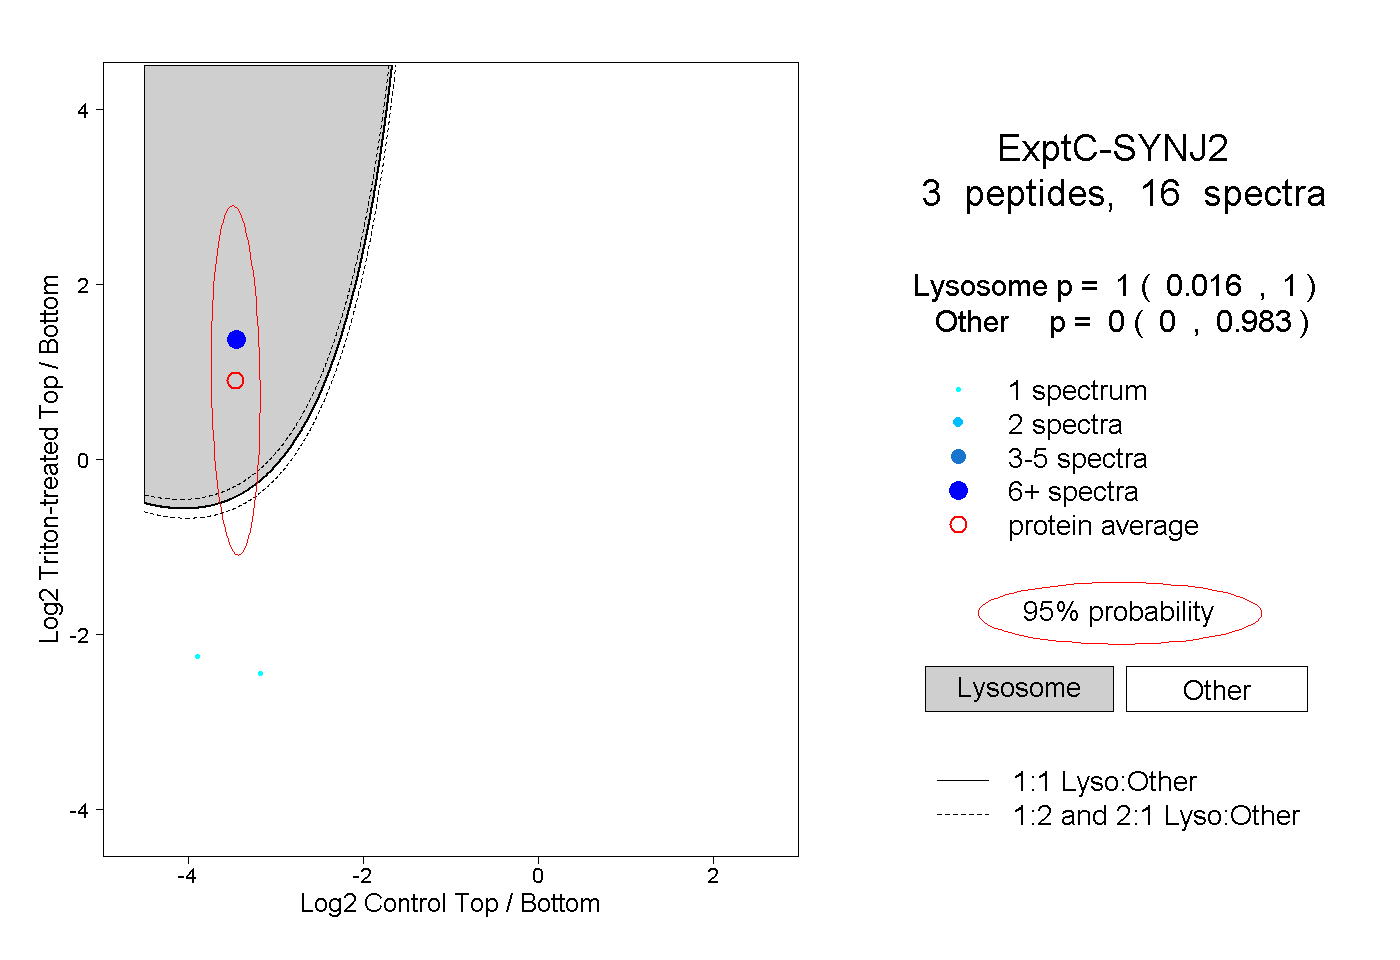
| Expt C |
3
peptides |
16
spectra |
 |
|
1.000
0.016 | 1.000 |
|
|
|
|
|
|
|
0.000
0.000 | 0.983 |
| 1 spectrum, TGMGGK |
|
0.000 |
|
|
|
|
|
|
|
1.000 |
| 1 spectrum, LMEFDQLQLQK |
|
0.000 |
|
|
|
|
|
|
|
1.000 |
| 14 spectra, IPDAEIYK |
|
1.000 |
|
|
|
|
|
|
|
0.000 |