 3
3peptides
spectra
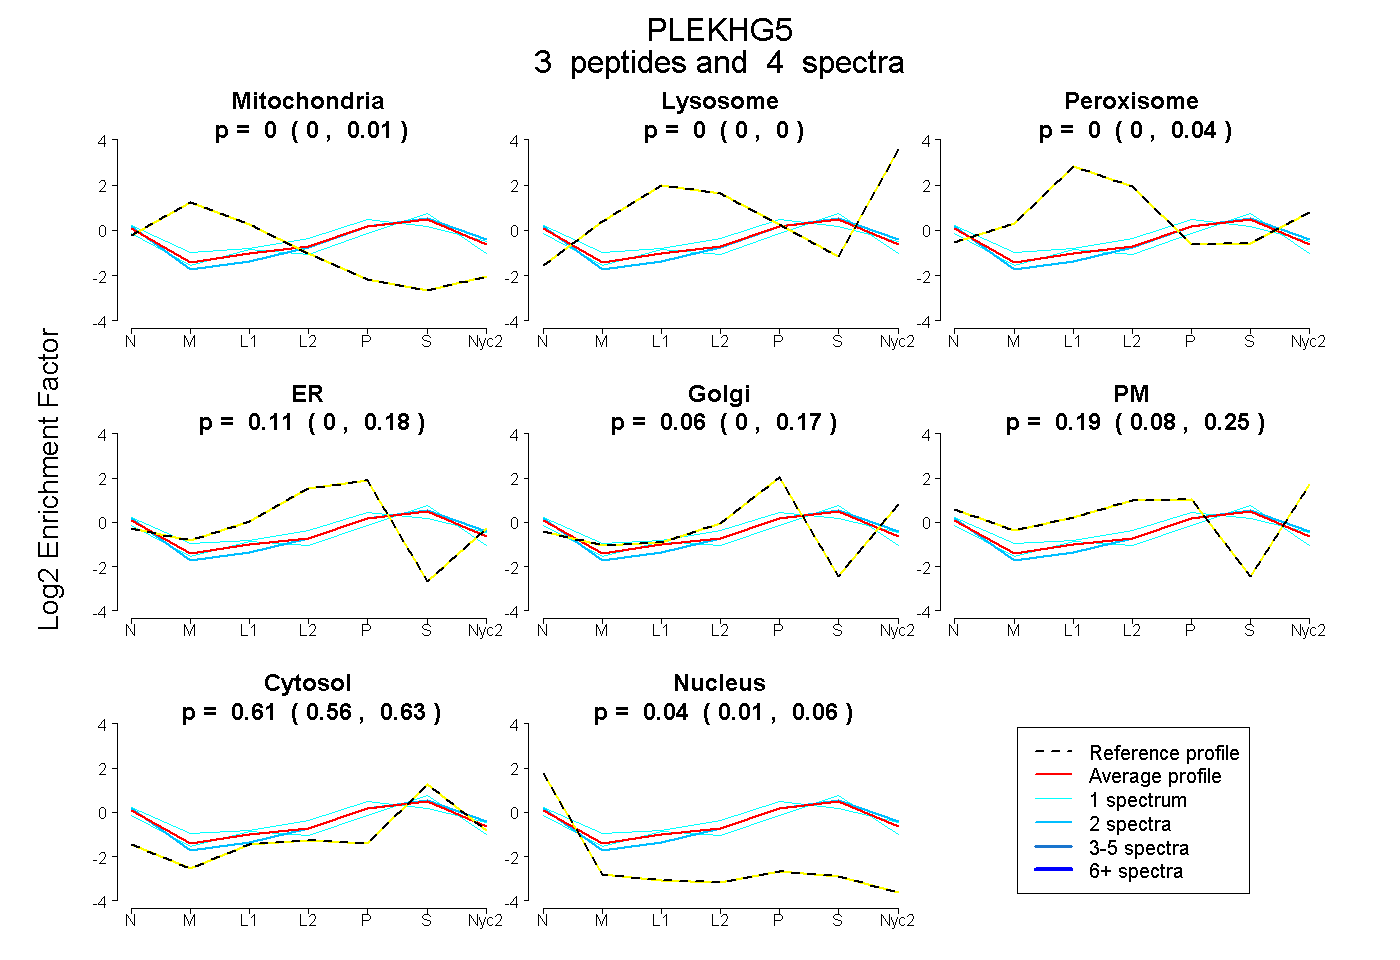
0.000 | 0.012
0.000 | 0.000
0.000 | 0.045
0.000 | 0.175
0.000 | 0.172
0.081 | 0.251
0.557 | 0.630
0.010 | 0.062
| Plot | Mito | Lyso | Perox | ER | Golgi | PM | Cytosol | Nucleus | |||||
| Expt A |
3 peptides |
4 spectra |
|
0.000 0.000 | 0.012 |
0.000 0.000 | 0.000 |
0.000 0.000 | 0.045 |
0.107 0.000 | 0.175 |
0.057 0.000 | 0.172 |
0.193 0.081 | 0.251 |
0.605 0.557 | 0.630 |
0.037 0.010 | 0.062 |
| 1 spectrum, LHAYSLFGLPR | 0.014 | 0.000 | 0.000 | 0.184 | 0.013 | 0.263 | 0.512 | 0.014 | ||
| 1 spectrum, FIHHVNTCMR | 0.000 | 0.000 | 0.098 | 0.068 | 0.125 | 0.000 | 0.637 | 0.072 | ||
| 2 spectra, VIRPPLLVDK | 0.000 | 0.000 | 0.000 | 0.000 | 0.173 | 0.179 | 0.606 | 0.042 |
| Plot | Lyso | Other | |||||||||||
| Expt C |
1 peptide |
1 spectrum |
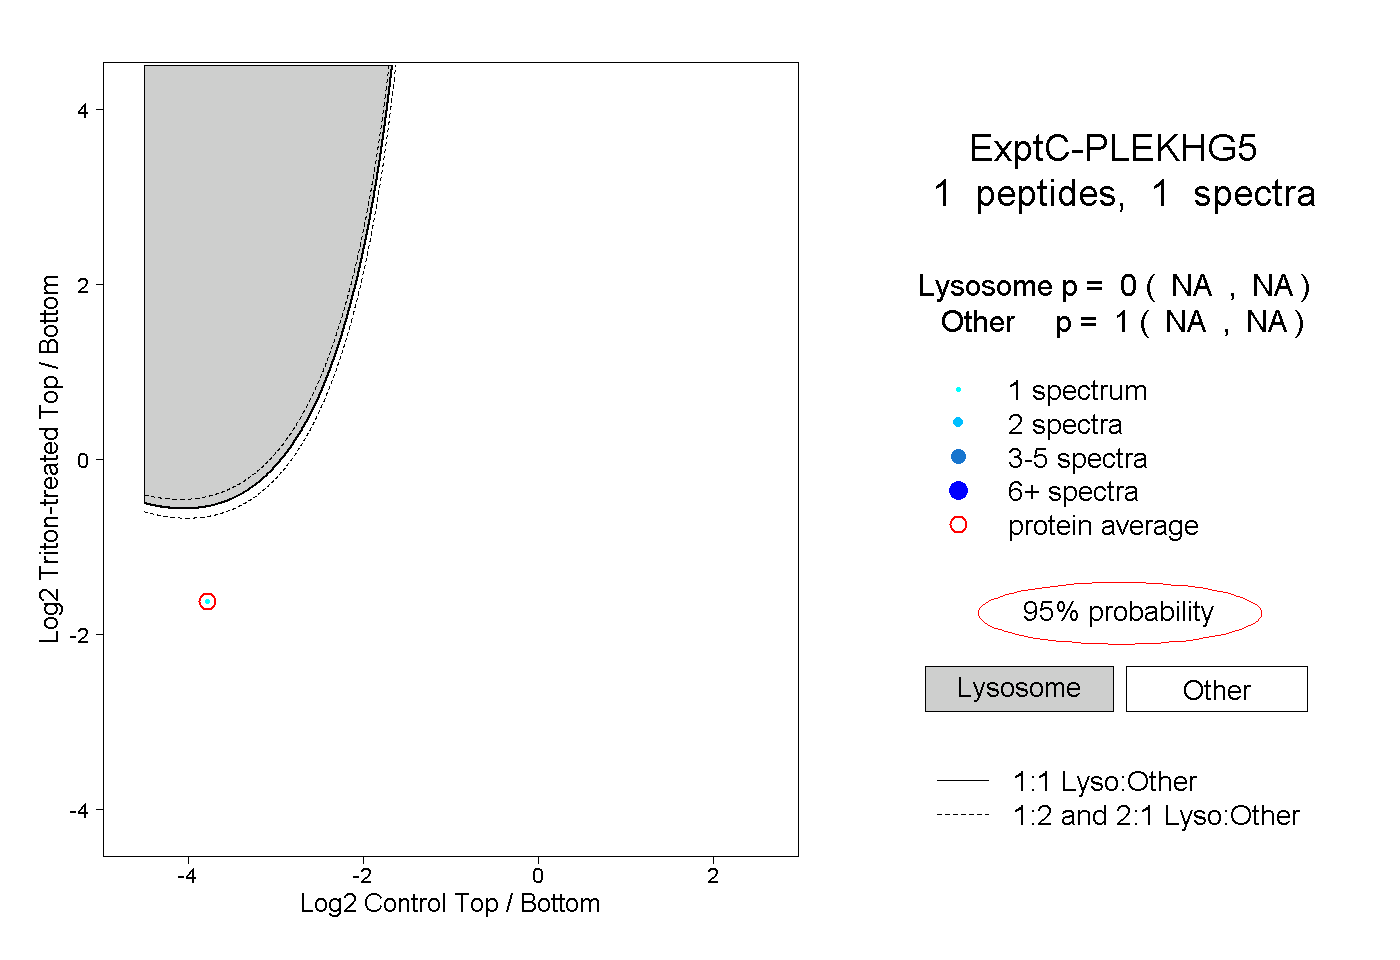 |
0.000 NA | NA |
1.000 NA | NA |