 1
1peptide
spectra
NA | NA
NA | NA
NA | NA
NA | NA
NA | NA
NA | NA
NA | NA
NA | NA
3peptides
spectra
0.007 | 0.931
0.067 | 0.993
| Plot | Mito | Lyso | Perox | ER | Golgi | PM | Cytosol | Nucleus | |||||
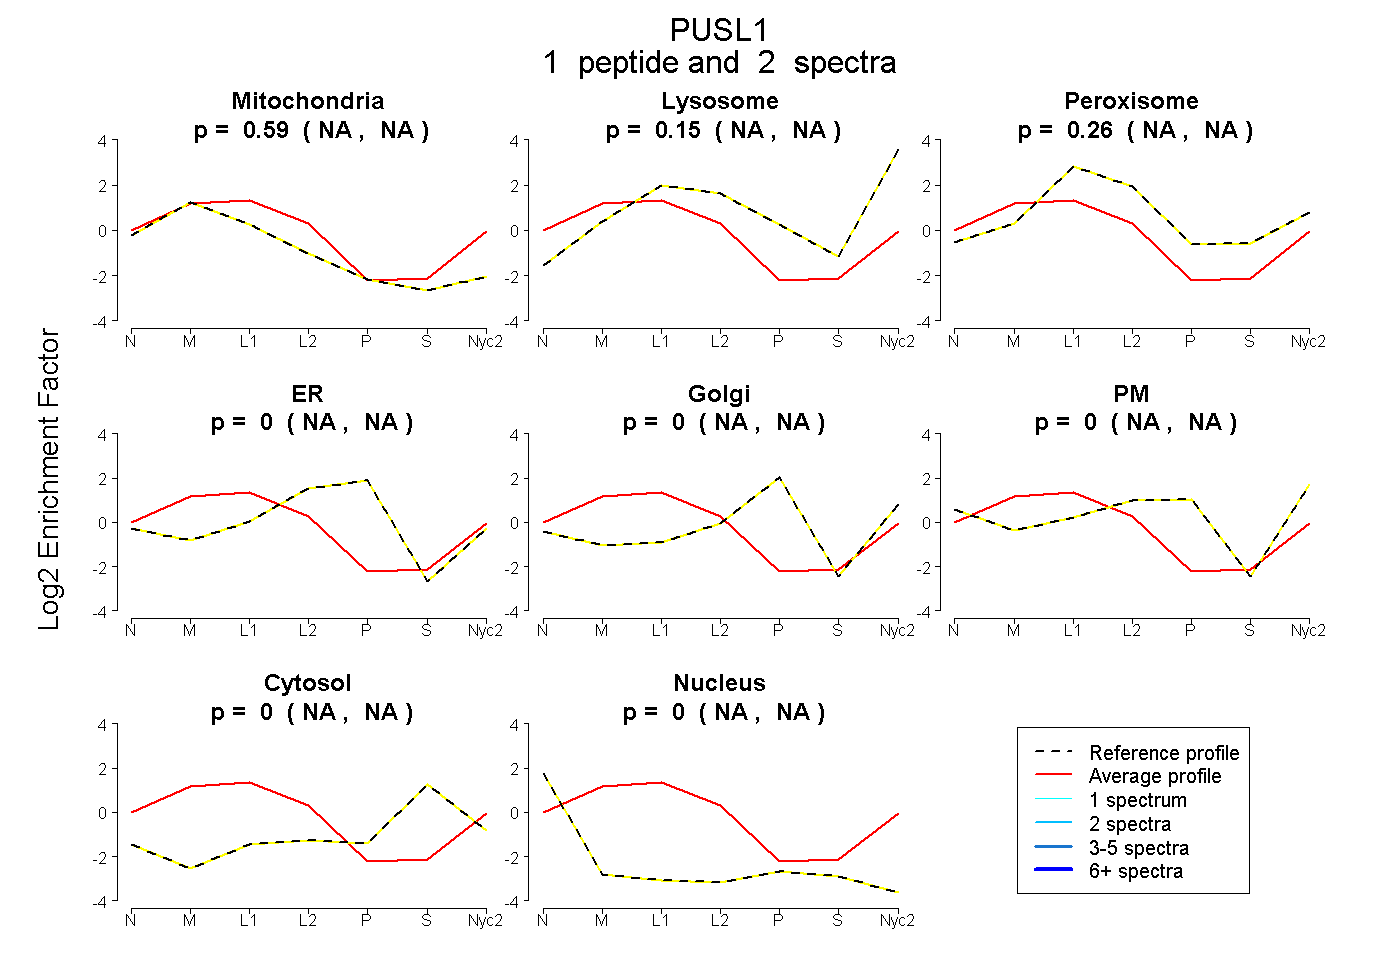
| Expt A |
1 peptide |
2 spectra |
|
0.595 NA | NA |
0.147 NA | NA |
0.258 NA | NA |
0.000 NA | NA |
0.000 NA | NA |
0.000 NA | NA |
0.000 NA | NA |
0.000 NA | NA |
||
| Plot | Lyso | Other | |||||||||||
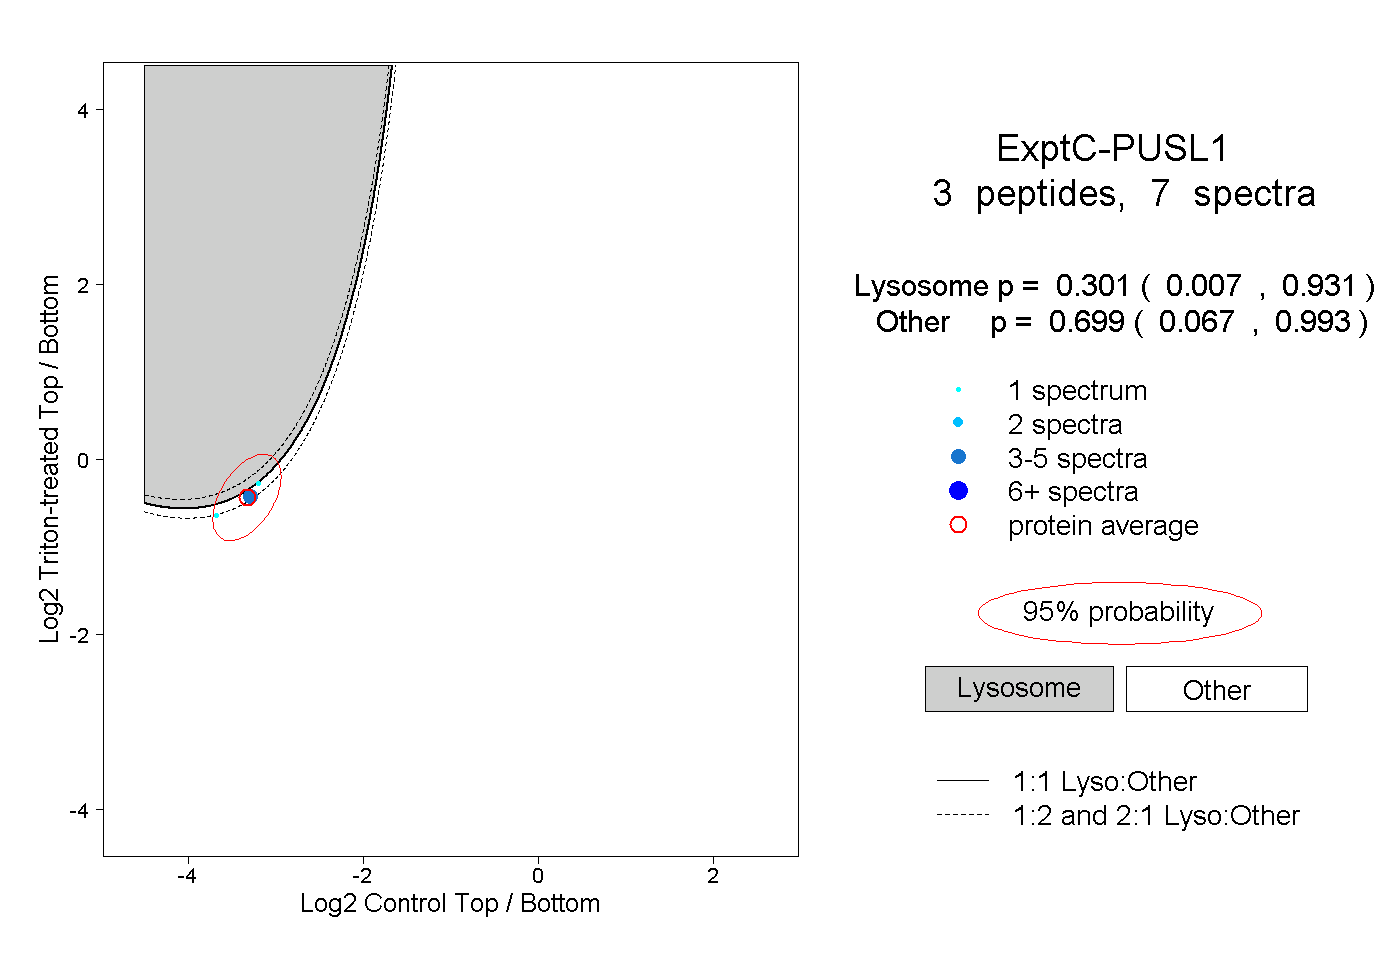
| Expt C |
3 peptides |
7 spectra |
|
0.301 0.007 | 0.931 |
0.699 0.067 | 0.993 |
| 5 spectra, VAPAHGLFLK | 0.263 | 0.737 | ||||||||
| 1 spectrum, VSVSPGPASLFVLPQESR | 0.456 | 0.544 | ||||||||
| 1 spectrum, VILESQDPLGK | 0.181 | 0.819 |