 1
1peptide
spectra
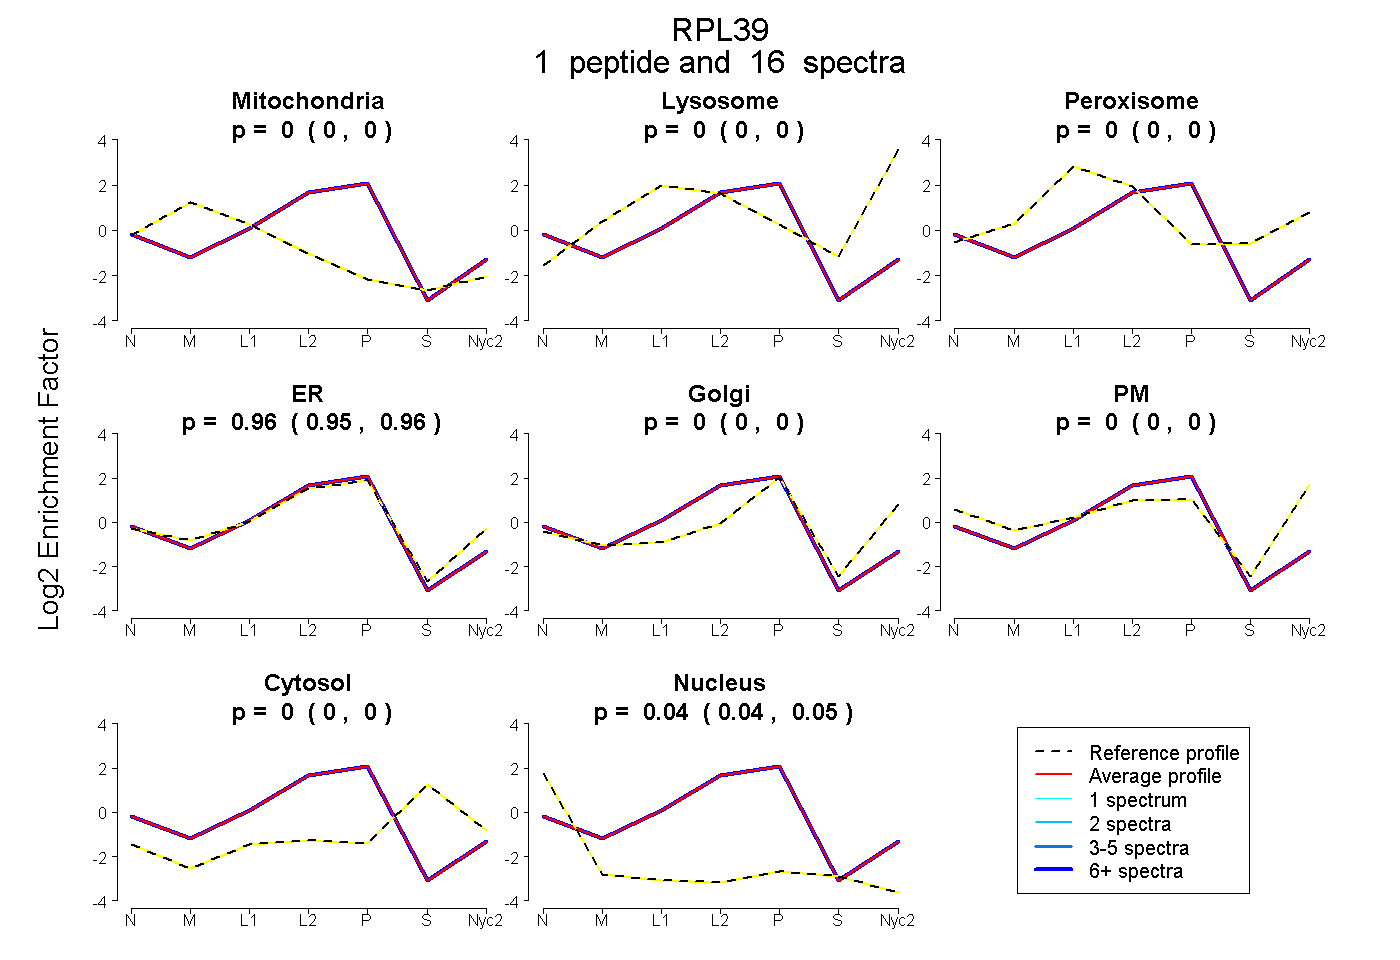
0.000 | 0.000
0.000 | 0.000
0.000 | 0.000
0.952 | 0.962
0.000 | 0.000
0.000 | 0.000
0.000 | 0.000
0.037 | 0.047
1peptide
spectra
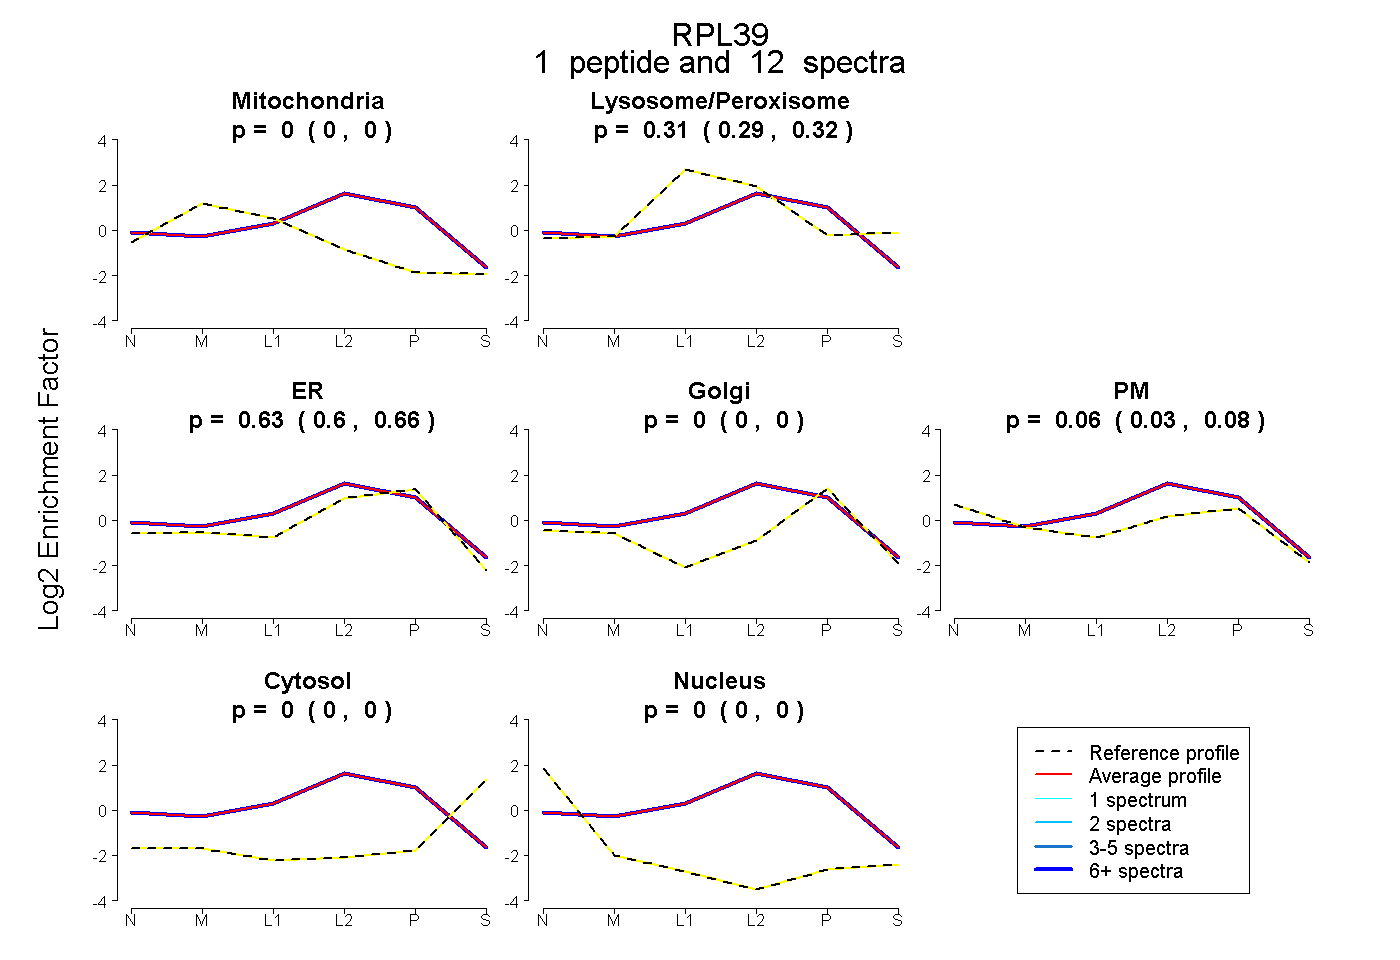
0.000 | 0.000
0.287 | 0.325
0.599 | 0.663
0.000 | 0.000
0.030 | 0.081
0.000 | 0.000
0.000 | 0.000
1peptide
spectra
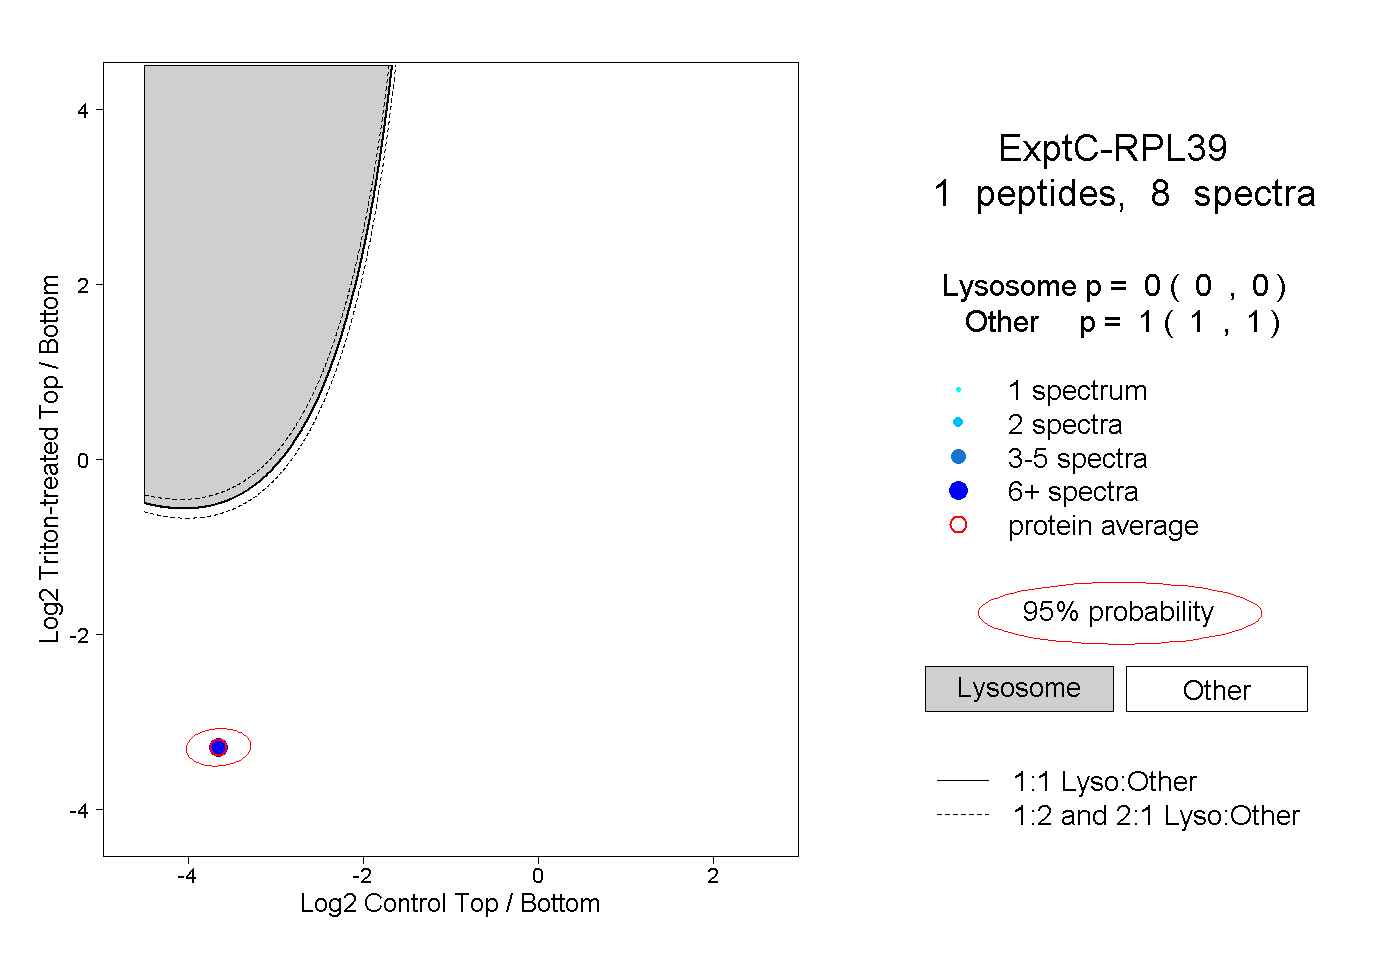
0.000 | 0.000
1.000 | 1.000
1peptide
spectra
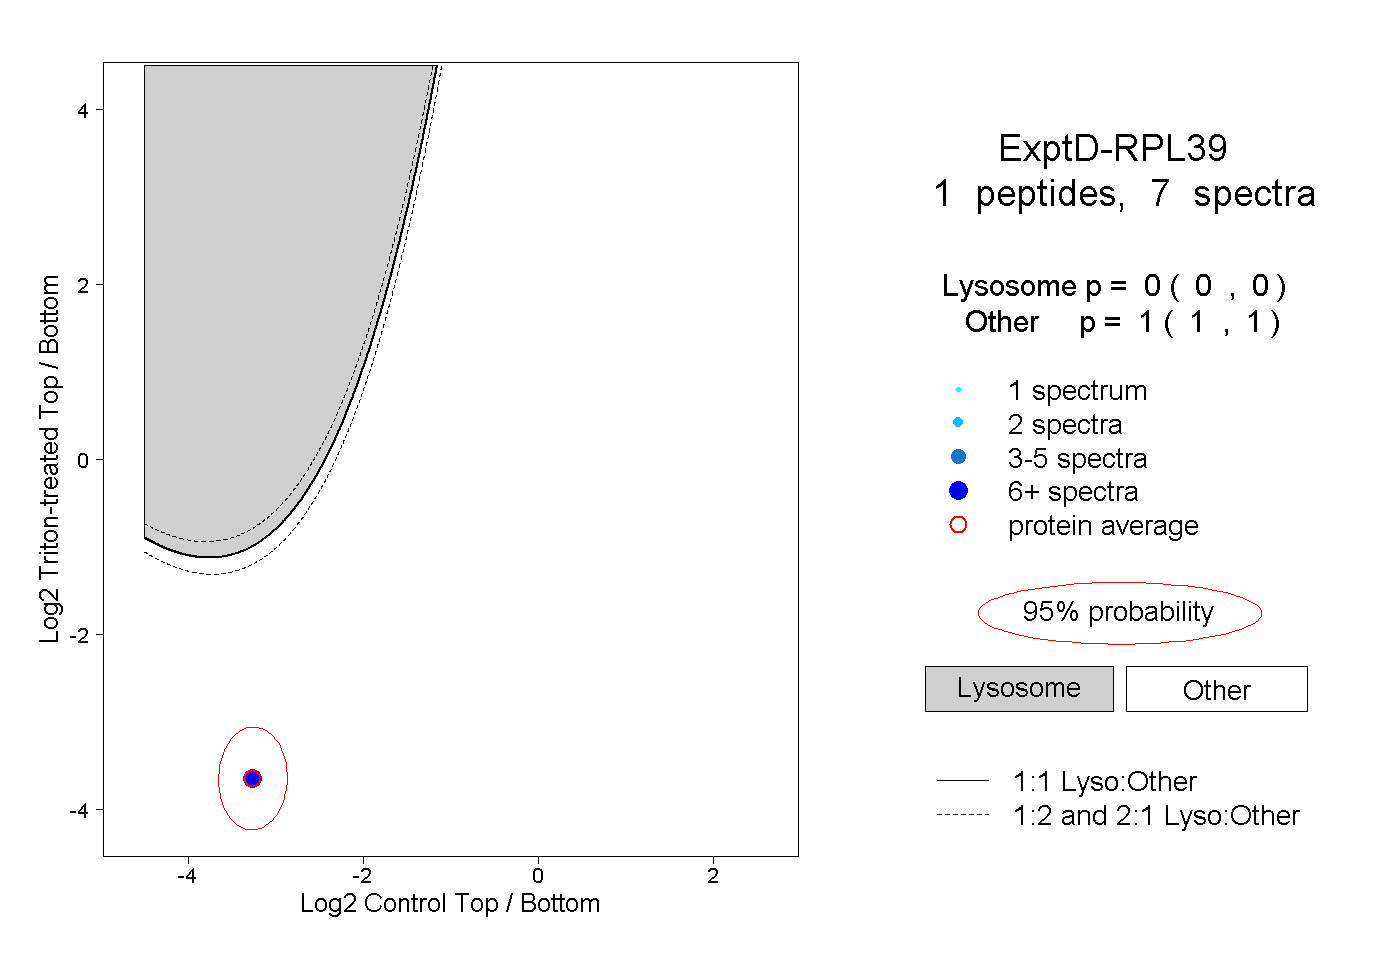
0.000 | 0.000
1.000 | 1.000