 9
9peptides
spectra
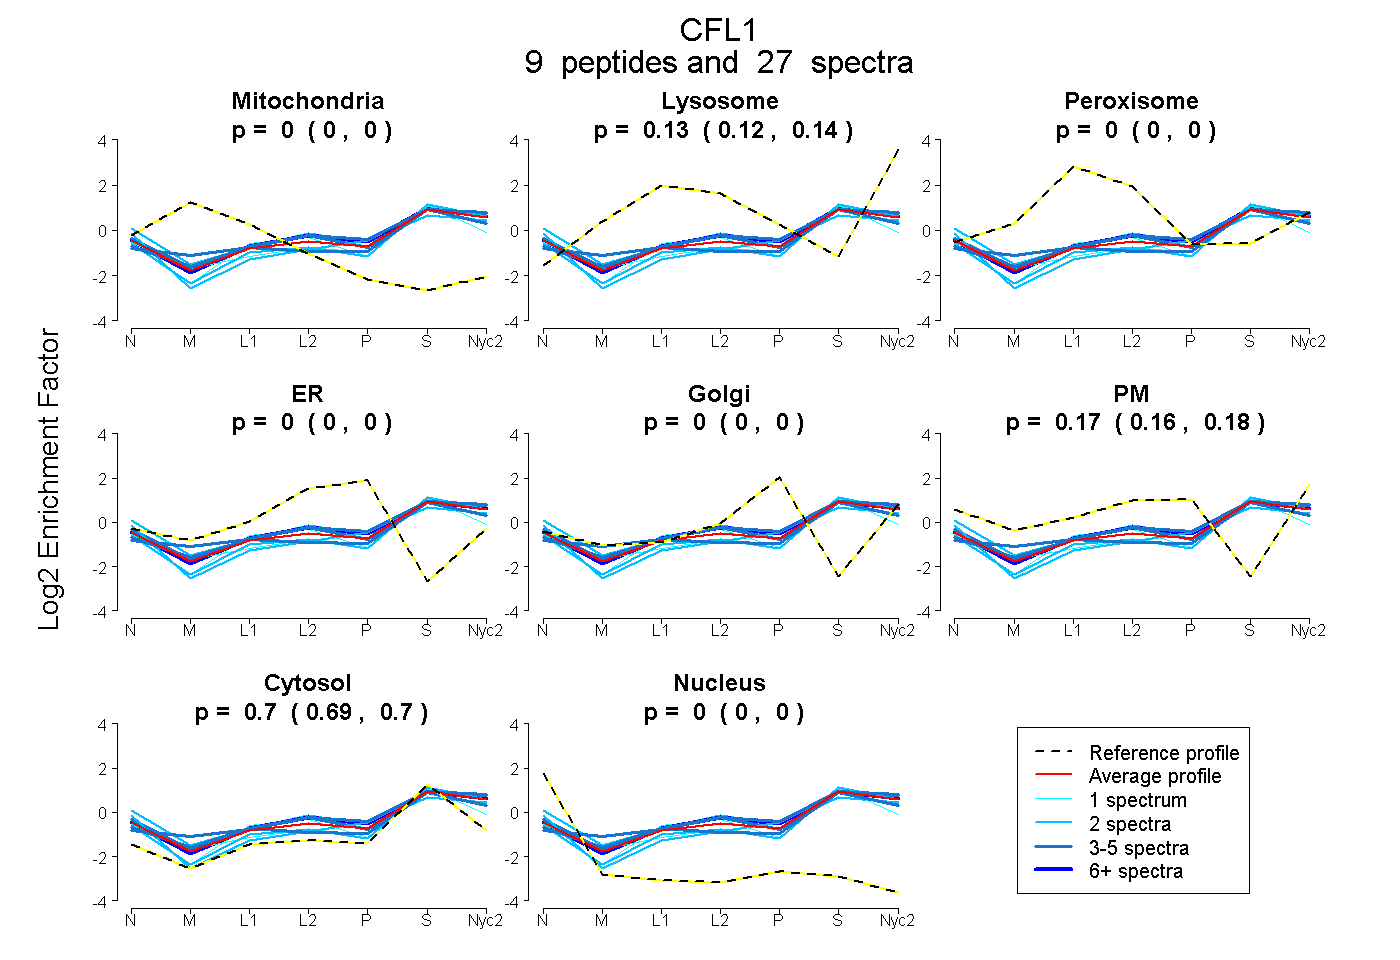
0.000 | 0.000
0.124 | 0.139
0.000 | 0.000
0.000 | 0.000
0.000 | 0.000
0.160 | 0.176
0.694 | 0.703
0.000 | 0.000
1peptide
spectra
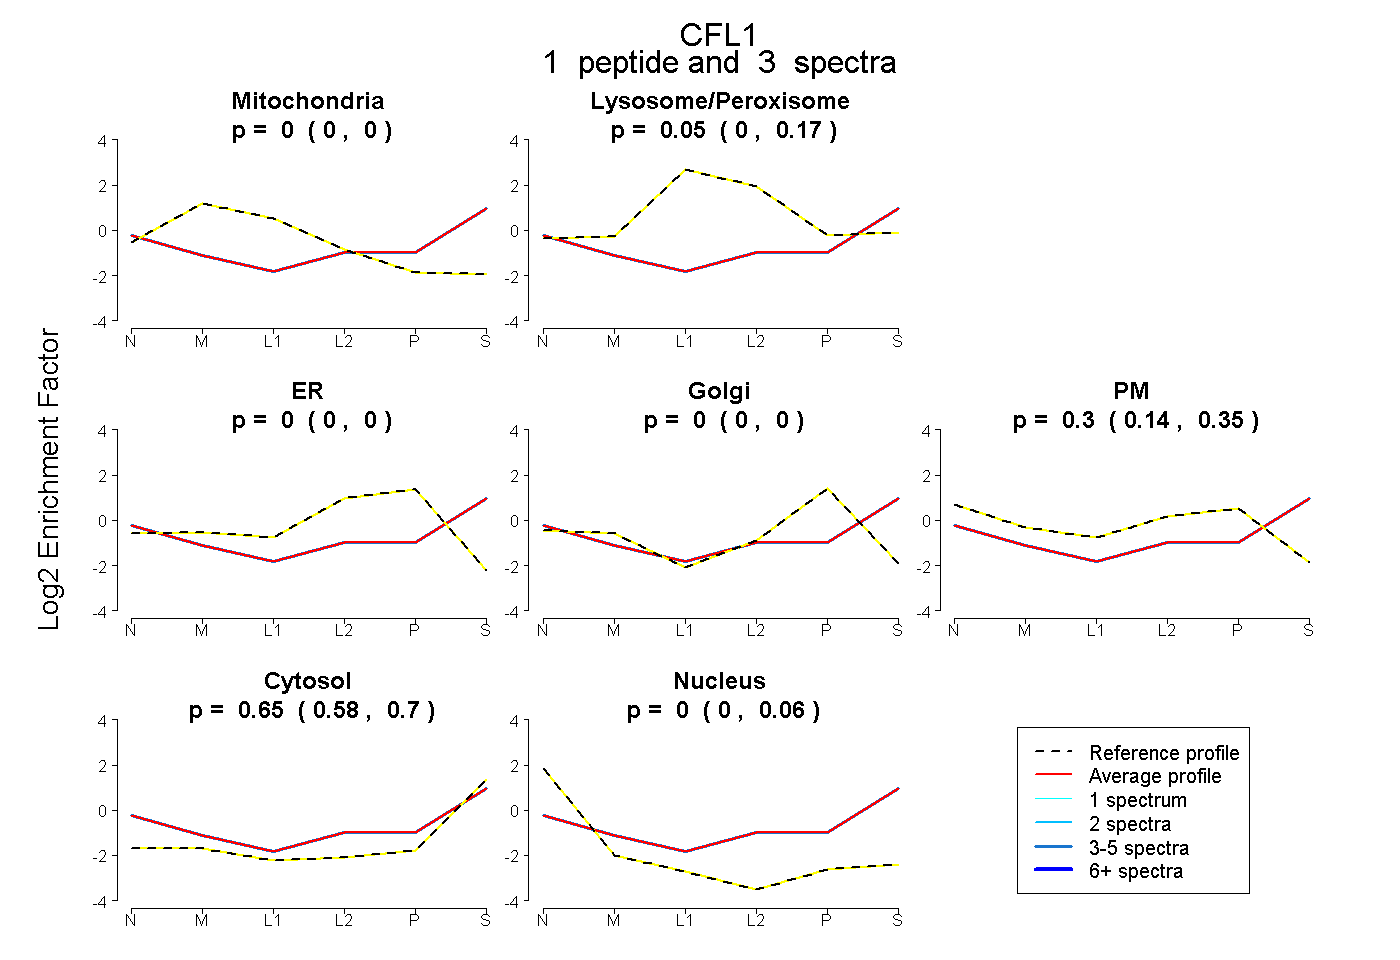
0.000 | 0.000
0.000 | 0.169
0.000 | 0.000
0.000 | 0.000
0.145 | 0.352
0.580 | 0.695
0.000 | 0.063
6peptides
spectra
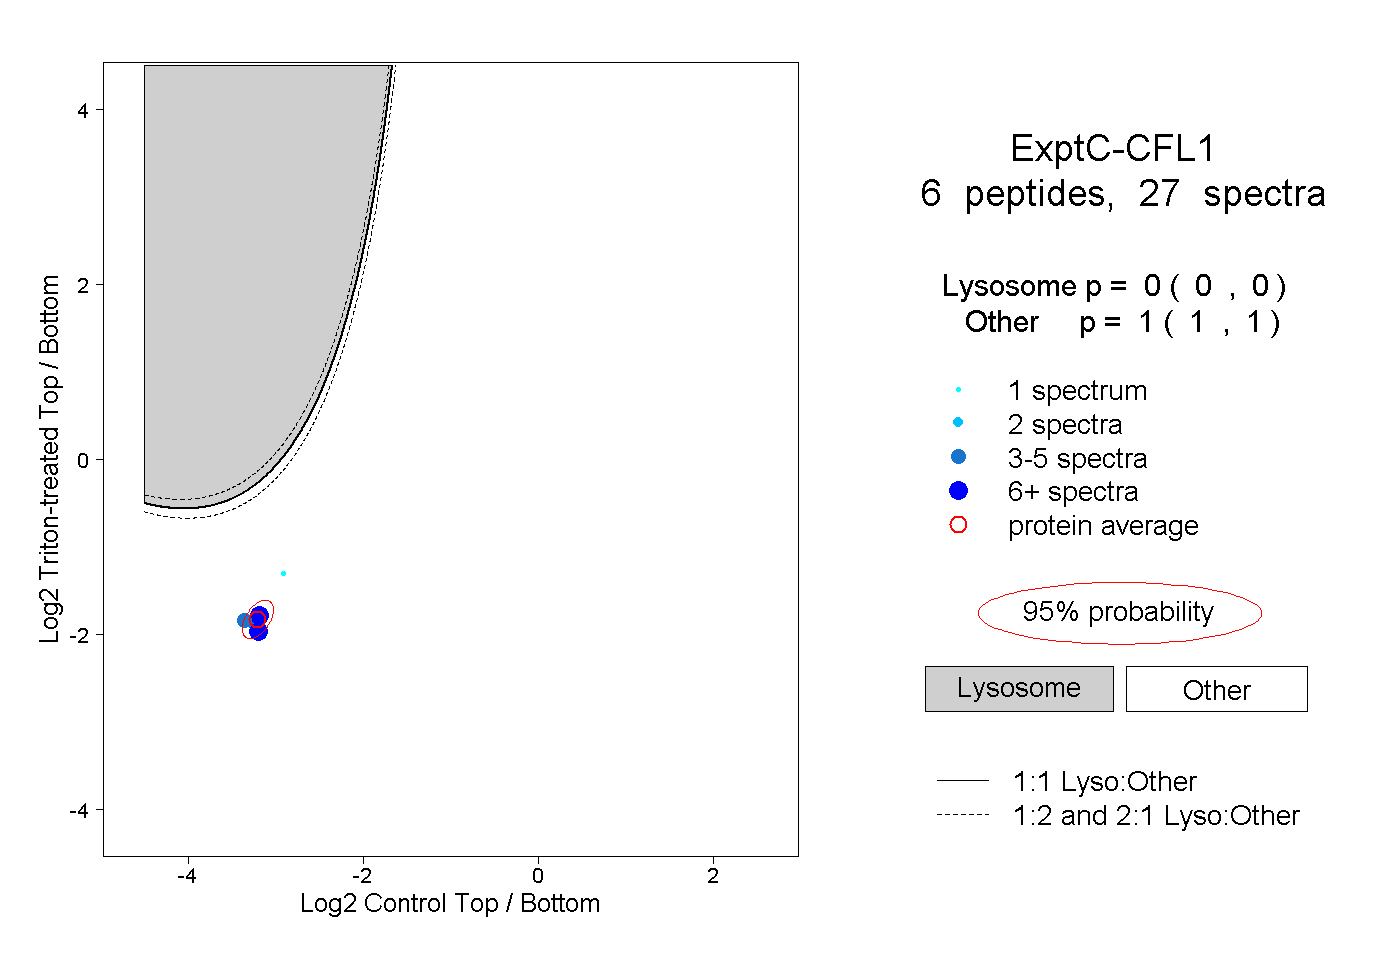
0.000 | 0.000
1.000 | 1.000