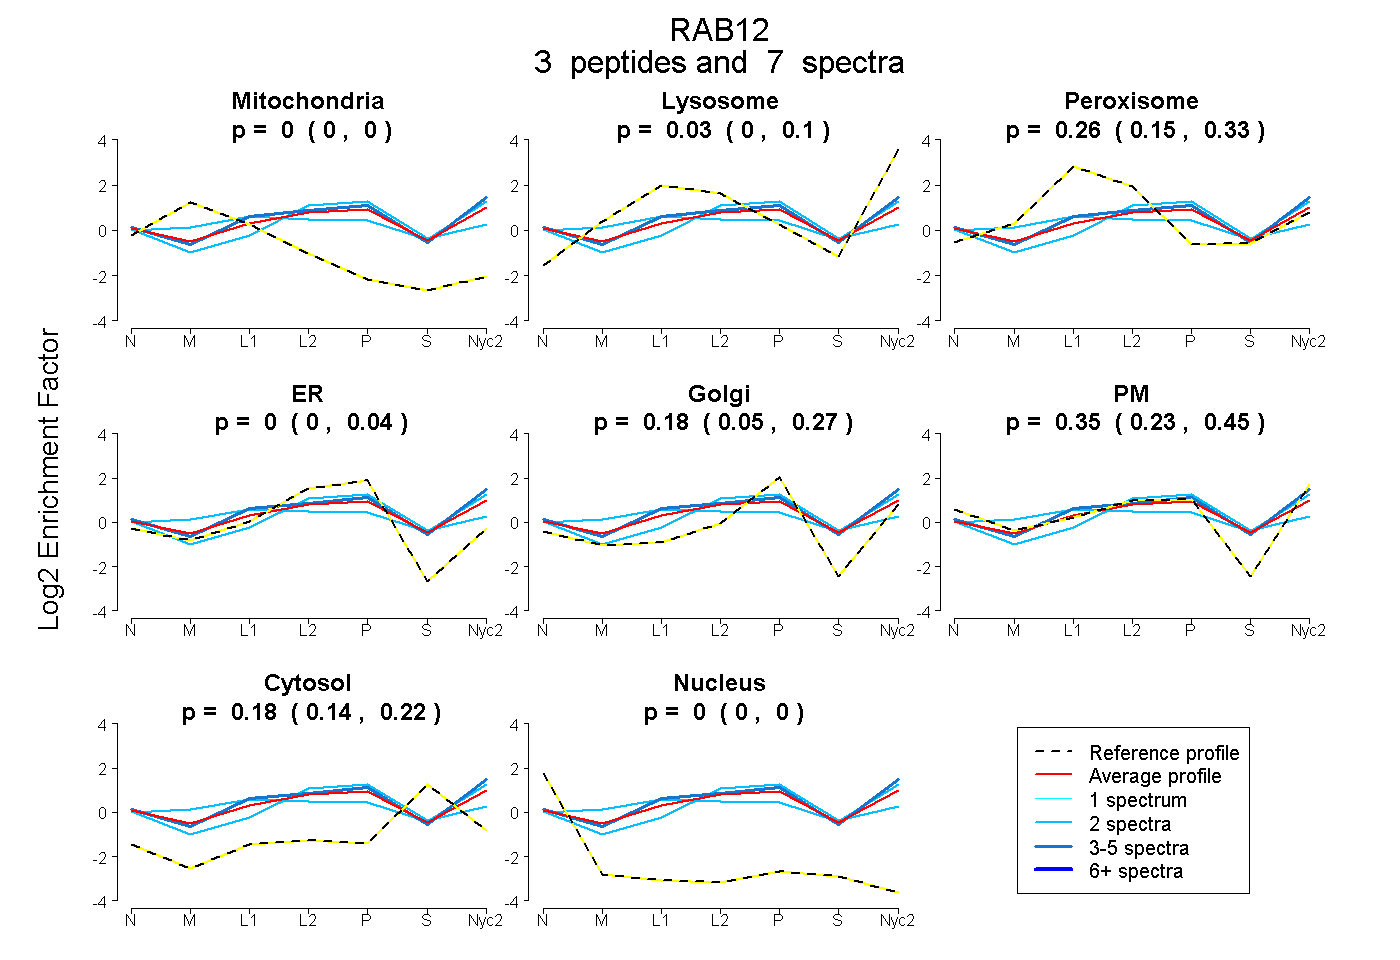
 3
3peptides
spectra
0.000 | 0.000
0.000 | 0.099
0.147 | 0.325
0.000 | 0.039
0.046 | 0.270
0.234 | 0.453
0.139 | 0.219
0.000 | 0.000
| Plot | Mito | Lyso | Perox | ER | Golgi | PM | Cytosol | Nucleus | |||||
| Expt A |
3 peptides |
7 spectra |
|
0.000 0.000 | 0.000 |
0.033 0.000 | 0.099 |
0.255 0.147 | 0.325 |
0.000 0.000 | 0.039 |
0.179 0.046 | 0.270 |
0.354 0.234 | 0.453 |
0.180 0.139 | 0.219 |
0.000 0.000 | 0.000 |
| 2 spectra, FTDDTFCEACK | 0.000 | 0.000 | 0.095 | 0.400 | 0.000 | 0.235 | 0.269 | 0.000 | ||
| 2 spectra, FNSITSAYYR | 0.000 | 0.133 | 0.232 | 0.000 | 0.000 | 0.423 | 0.211 | 0.000 | ||
| 3 spectra, LQVIIIGSR | 0.000 | 0.139 | 0.174 | 0.000 | 0.117 | 0.421 | 0.149 | 0.000 |
| Plot | Lyso | Other | |||||||||||
| Expt C |
8 peptides |
15 spectra |
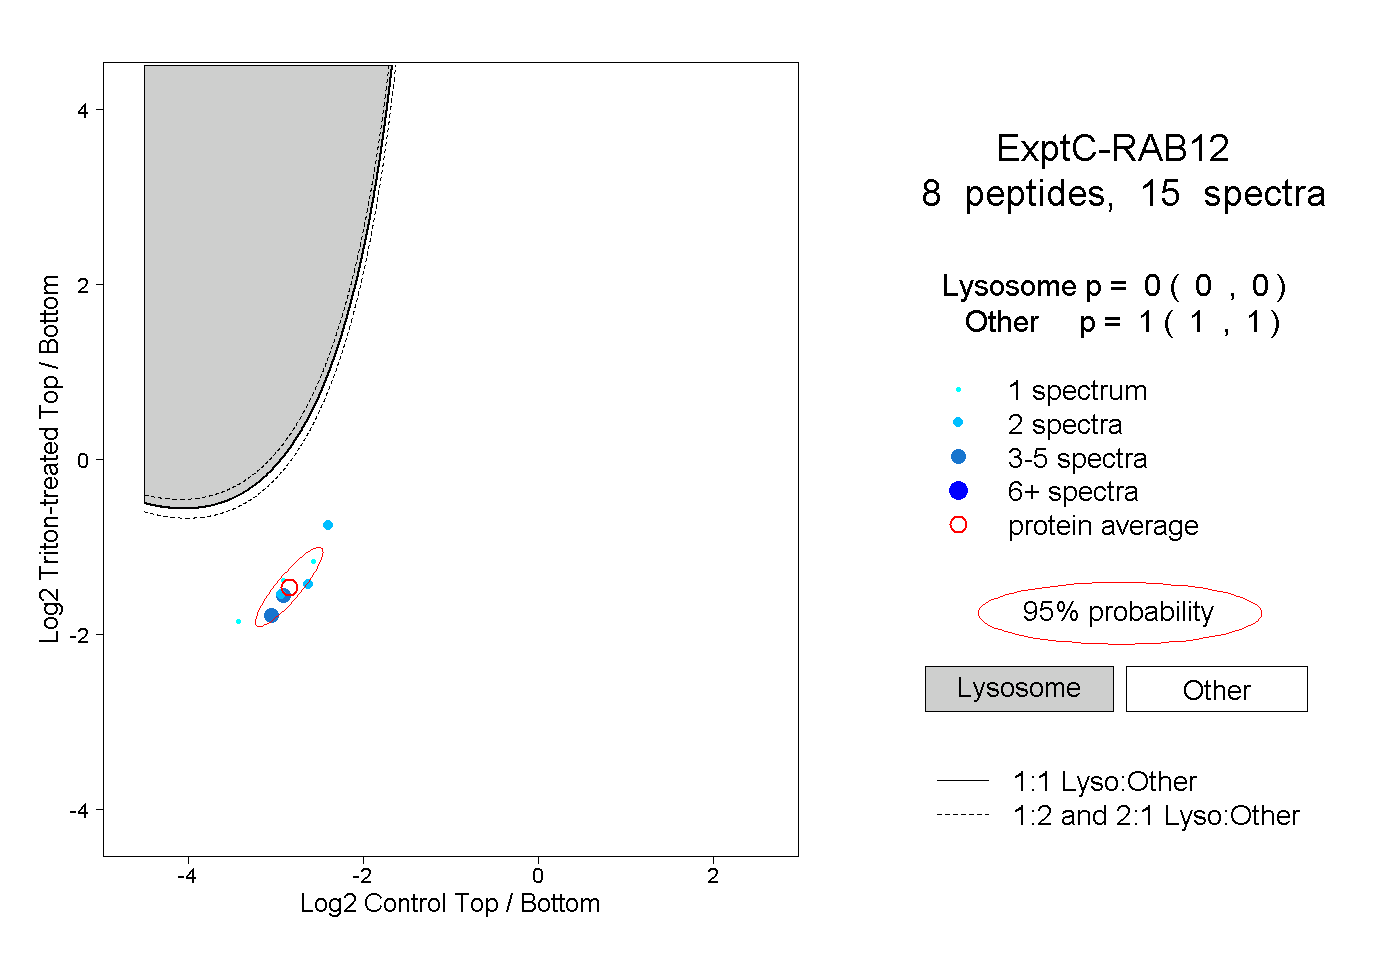 |
0.000 0.000 | 0.000 |
1.000 1.000 | 1.000 |