 2
2peptides
spectra
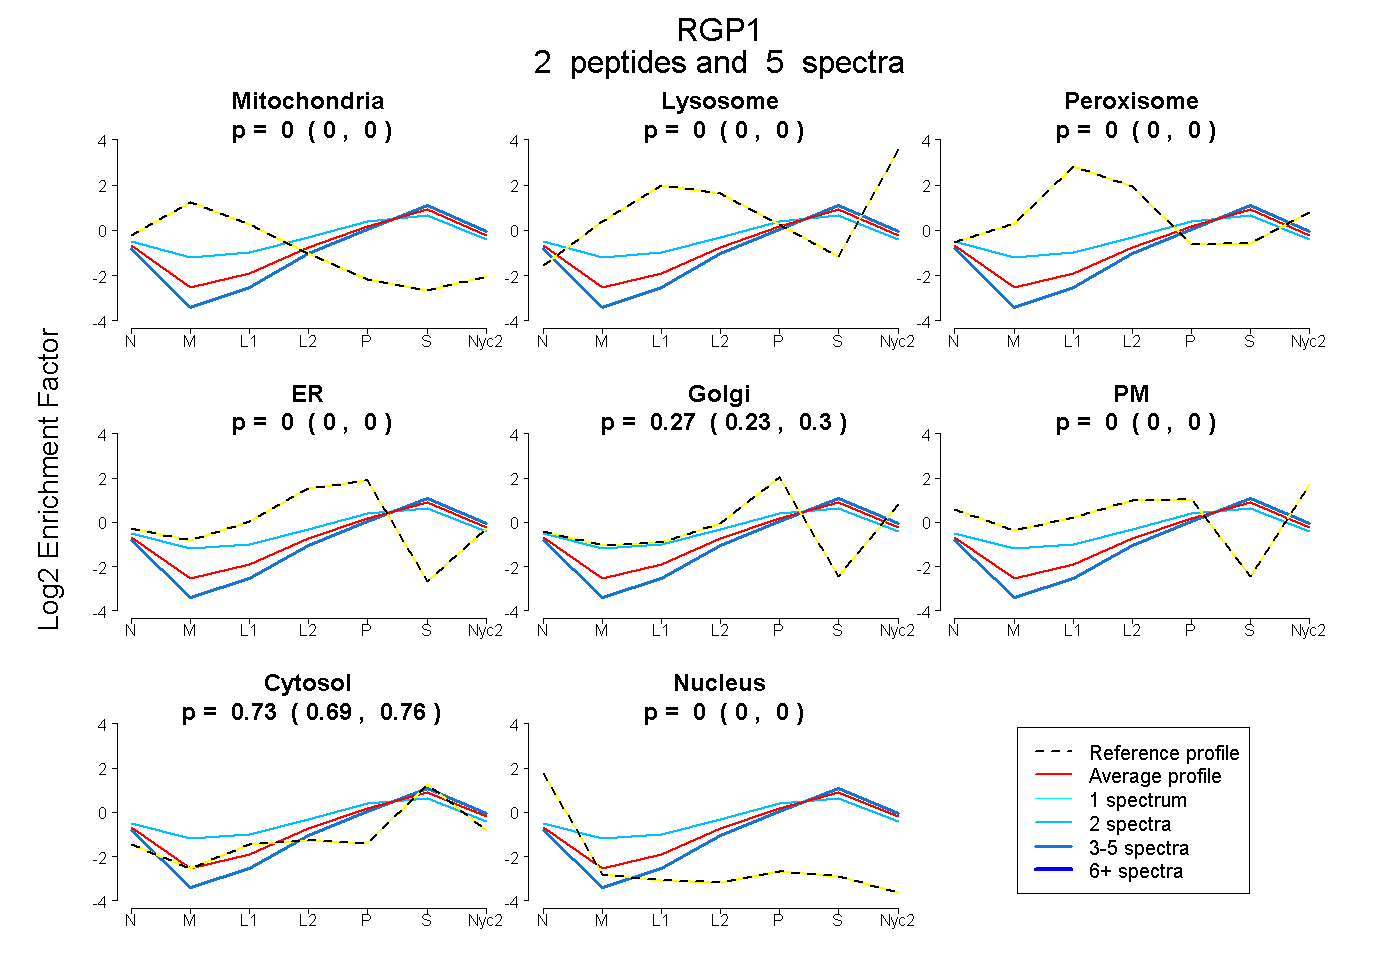
0.000 | 0.000
0.000 | 0.000
0.000 | 0.000
0.000 | 0.000
0.229 | 0.296
0.000 | 0.000
0.694 | 0.762
0.000 | 0.000
| Plot | Mito | Lyso | Perox | ER | Golgi | PM | Cytosol | Nucleus | |||||
| Expt A |
2 peptides |
5 spectra |
|
0.000 0.000 | 0.000 |
0.000 0.000 | 0.000 |
0.000 0.000 | 0.000 |
0.000 0.000 | 0.000 |
0.268 0.229 | 0.296 |
0.000 0.000 | 0.000 |
0.732 0.694 | 0.762 |
0.000 0.000 | 0.000 |
| 3 spectra, LHFEFVTSR | 0.000 | 0.000 | 0.000 | 0.000 | 0.175 | 0.000 | 0.825 | 0.000 | ||
| 2 spectra, VQPEYQR | 0.000 | 0.000 | 0.087 | 0.122 | 0.217 | 0.000 | 0.573 | 0.000 |
| Plot | Lyso | Other | |||||||||||
| Expt C |
2 peptides |
6 spectra |
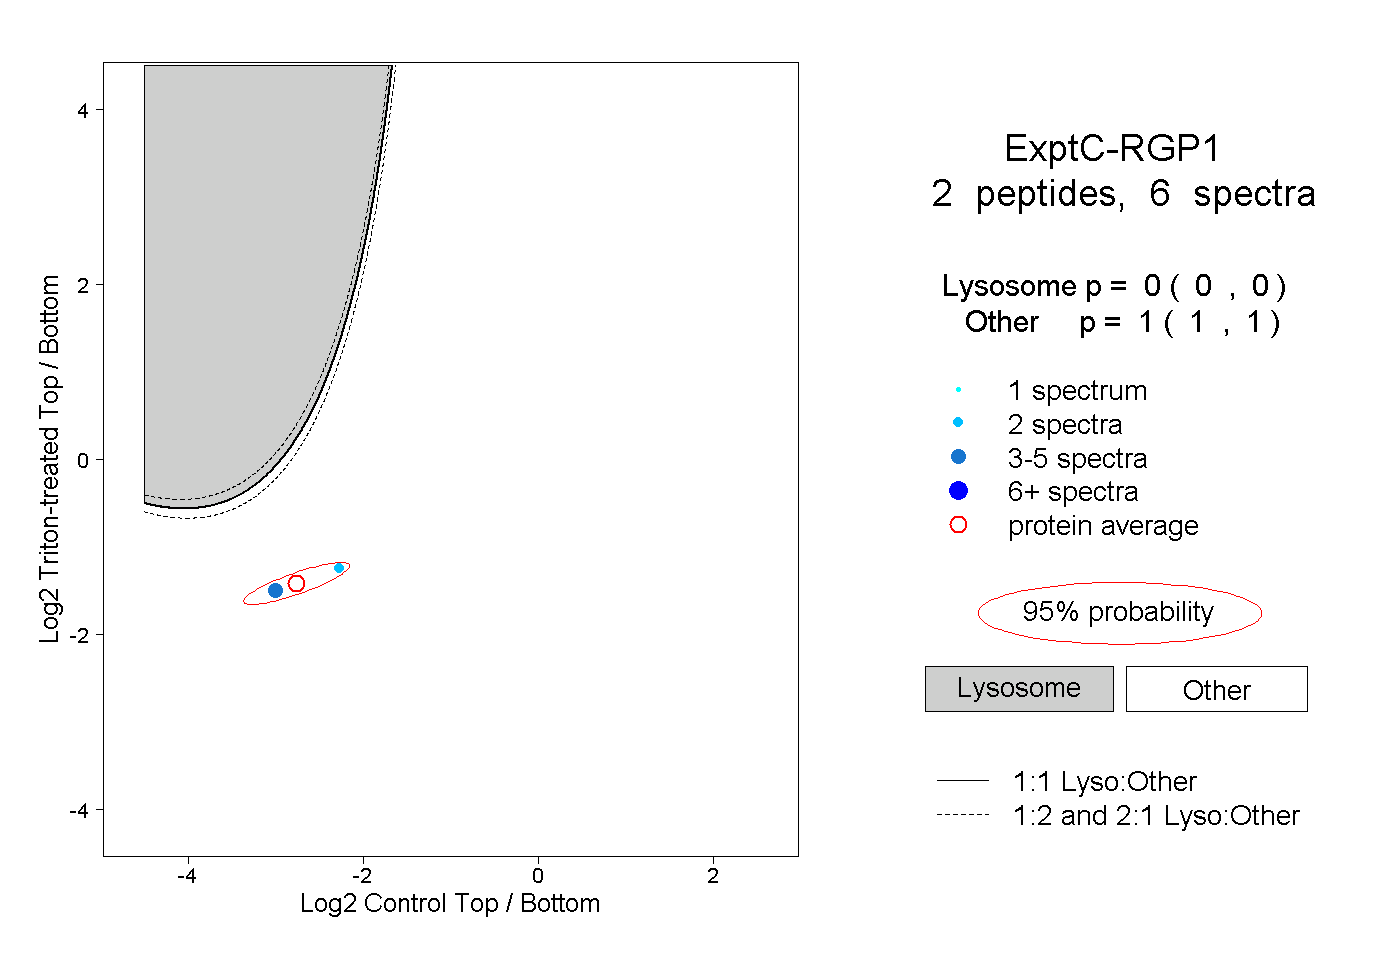 |
0.000 0.000 | 0.000 |
1.000 1.000 | 1.000 |