 7
7peptides
spectra
0.000 | 0.000
0.000 | 0.000
0.000 | 0.087
0.121 | 0.452
0.000 | 0.288
0.000 | 0.167
0.203 | 0.373
0.138 | 0.244
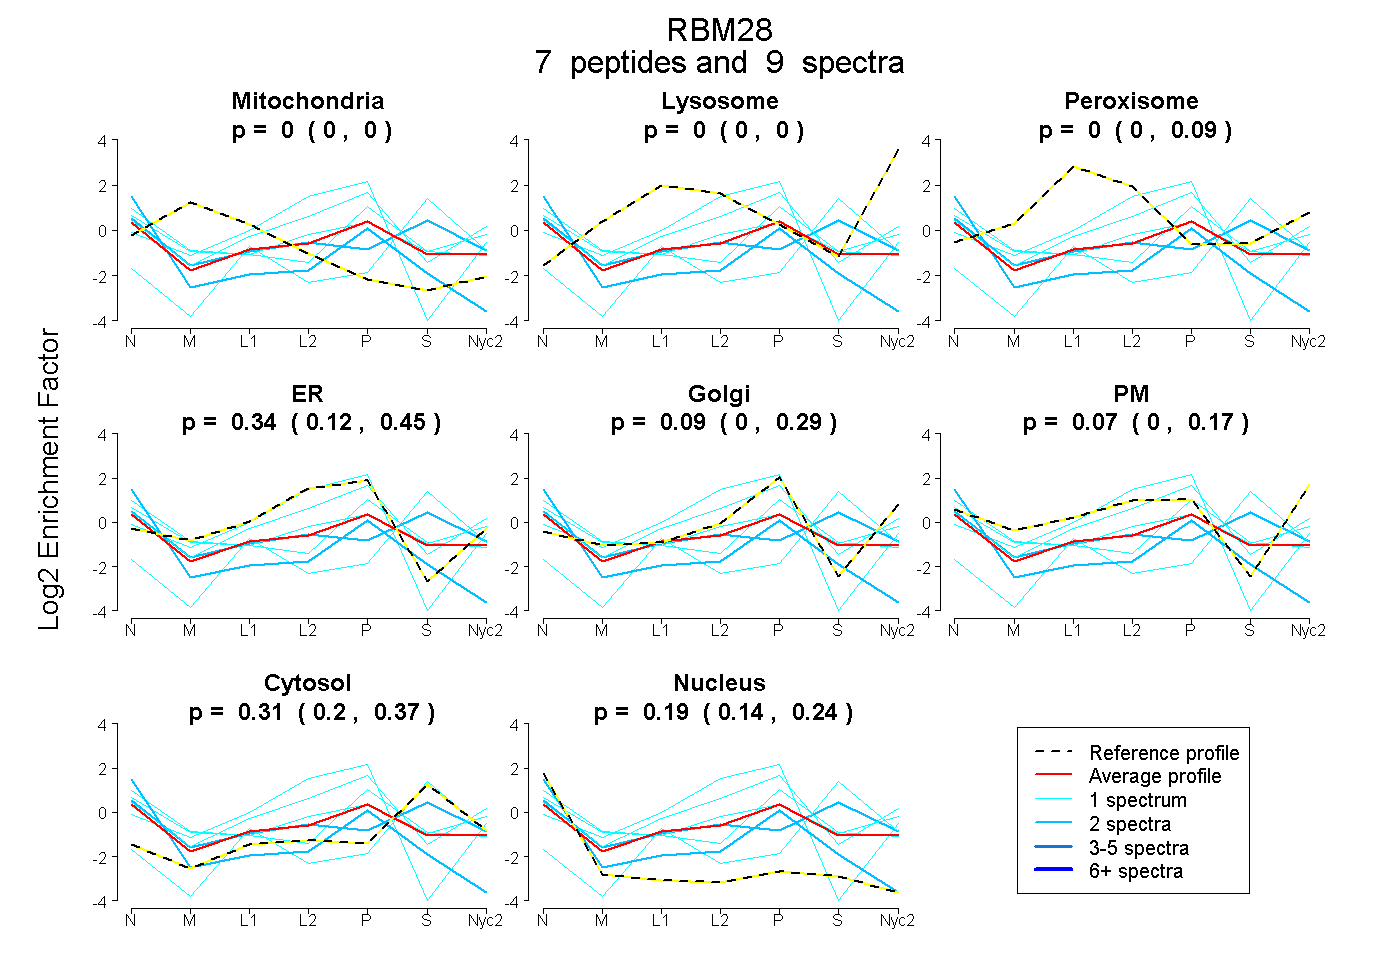
| Plot | Mito | Lyso | Perox | ER | Golgi | PM | Cytosol | Nucleus | |||||
| Expt A |
7 peptides |
9 spectra |
|
0.000 0.000 | 0.000 |
0.000 0.000 | 0.000 |
0.000 0.000 | 0.087 |
0.343 0.121 | 0.452 |
0.086 0.000 | 0.288 |
0.071 0.000 | 0.167 |
0.310 0.203 | 0.373 |
0.191 0.138 | 0.244 |
| 1 spectrum, NLYLAR | 0.000 | 0.000 | 0.000 | 0.000 | 0.000 | 0.000 | 0.992 | 0.008 | ||
| 1 spectrum, GQSLGYAFVEFQK | 0.079 | 0.000 | 0.000 | 0.000 | 0.546 | 0.000 | 0.196 | 0.180 | ||
| 2 spectra, VDLAVTR | 0.000 | 0.000 | 0.000 | 0.316 | 0.000 | 0.000 | 0.029 | 0.655 | ||
| 1 spectrum, INVTIAK | 0.000 | 0.000 | 0.000 | 0.418 | 0.203 | 0.206 | 0.172 | 0.002 | ||
| 2 spectra, HEHALR | 0.000 | 0.000 | 0.165 | 0.000 | 0.000 | 0.148 | 0.515 | 0.172 | ||
| 1 spectrum, GASLVK | 0.000 | 0.000 | 0.000 | 0.980 | 0.000 | 0.000 | 0.000 | 0.020 | ||
| 1 spectrum, IVLHPDTEHSK | 0.000 | 0.000 | 0.000 | 0.058 | 0.000 | 0.531 | 0.247 | 0.163 |