 5
5peptides
spectra
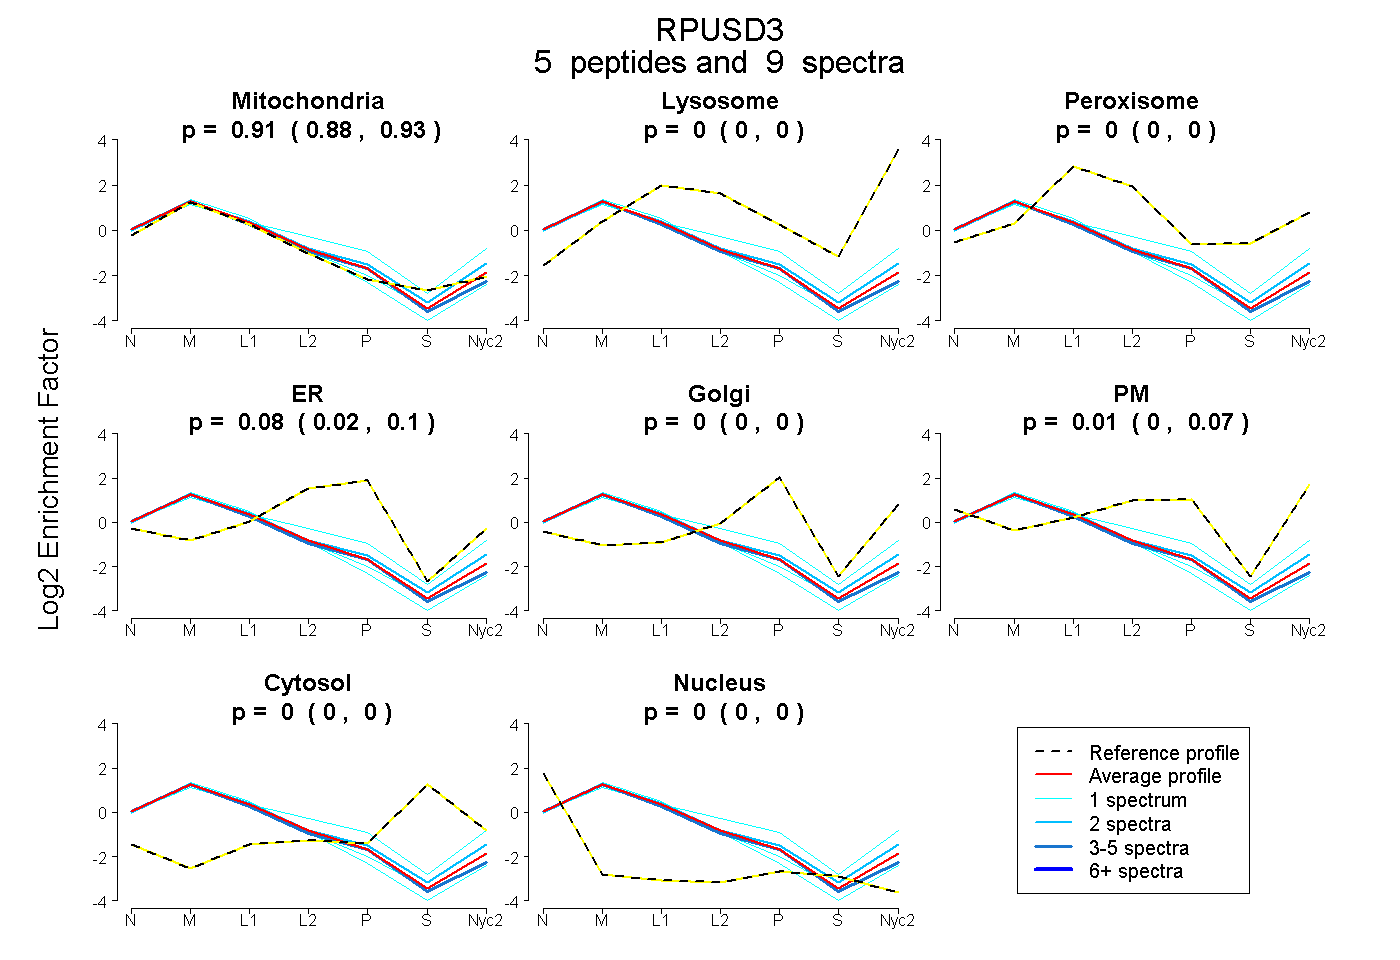
0.883 | 0.925
0.000 | 0.000
0.000 | 0.000
0.022 | 0.103
0.000 | 0.000
0.000 | 0.069
0.000 | 0.000
0.000 | 0.000
3peptides
spectra
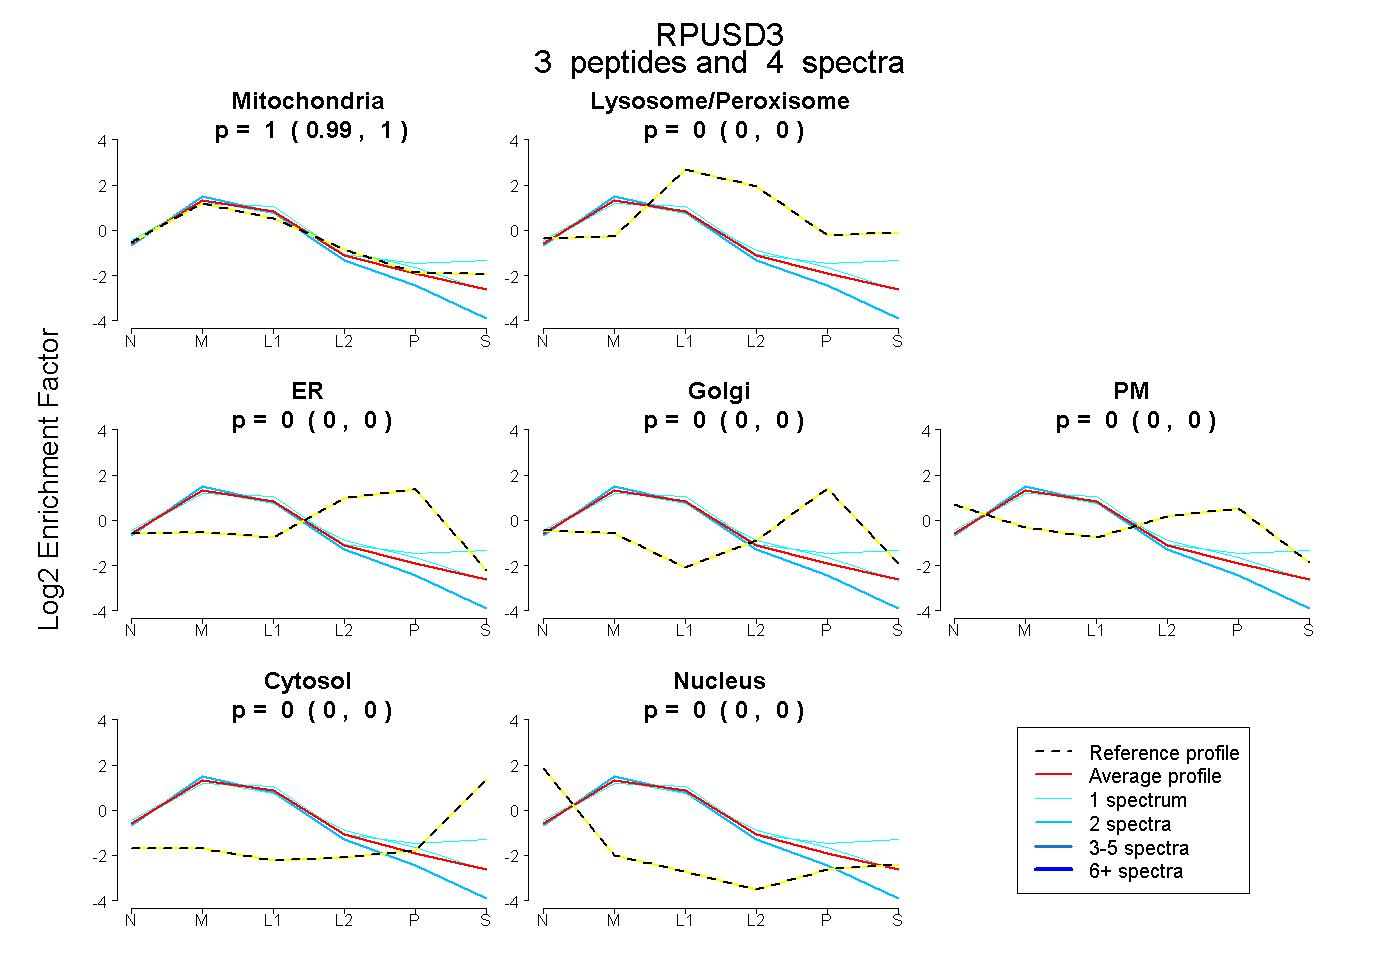
0.991 | 1.000
0.000 | 0.000
0.000 | 0.000
0.000 | 0.000
0.000 | 0.000
0.000 | 0.000
0.000 | 0.000
3peptides
spectra
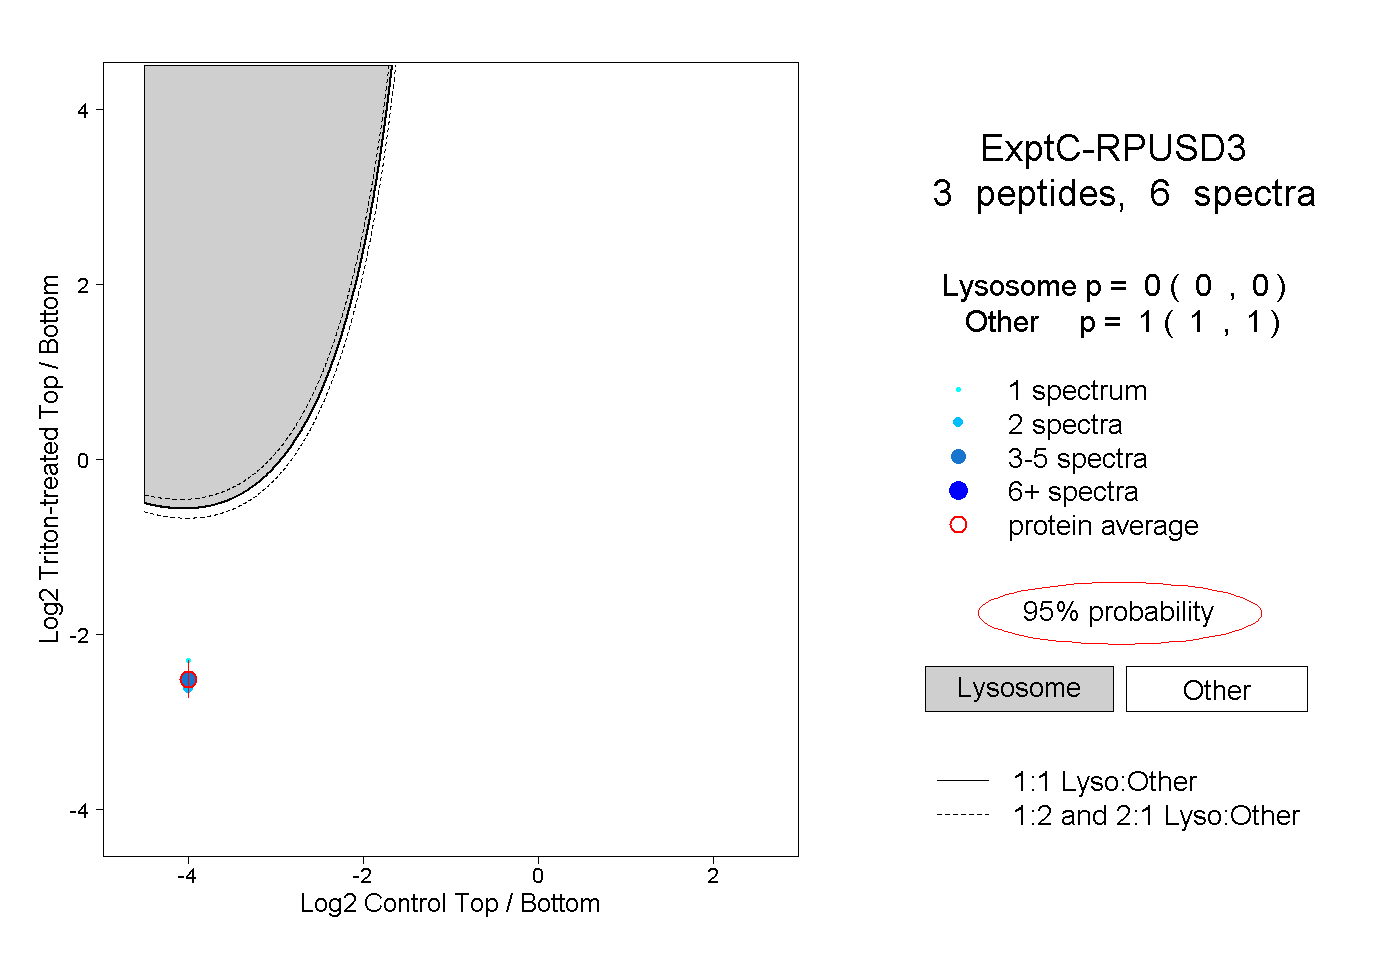
0.000 | 0.000
1.000 | 1.000
2peptides
spectra
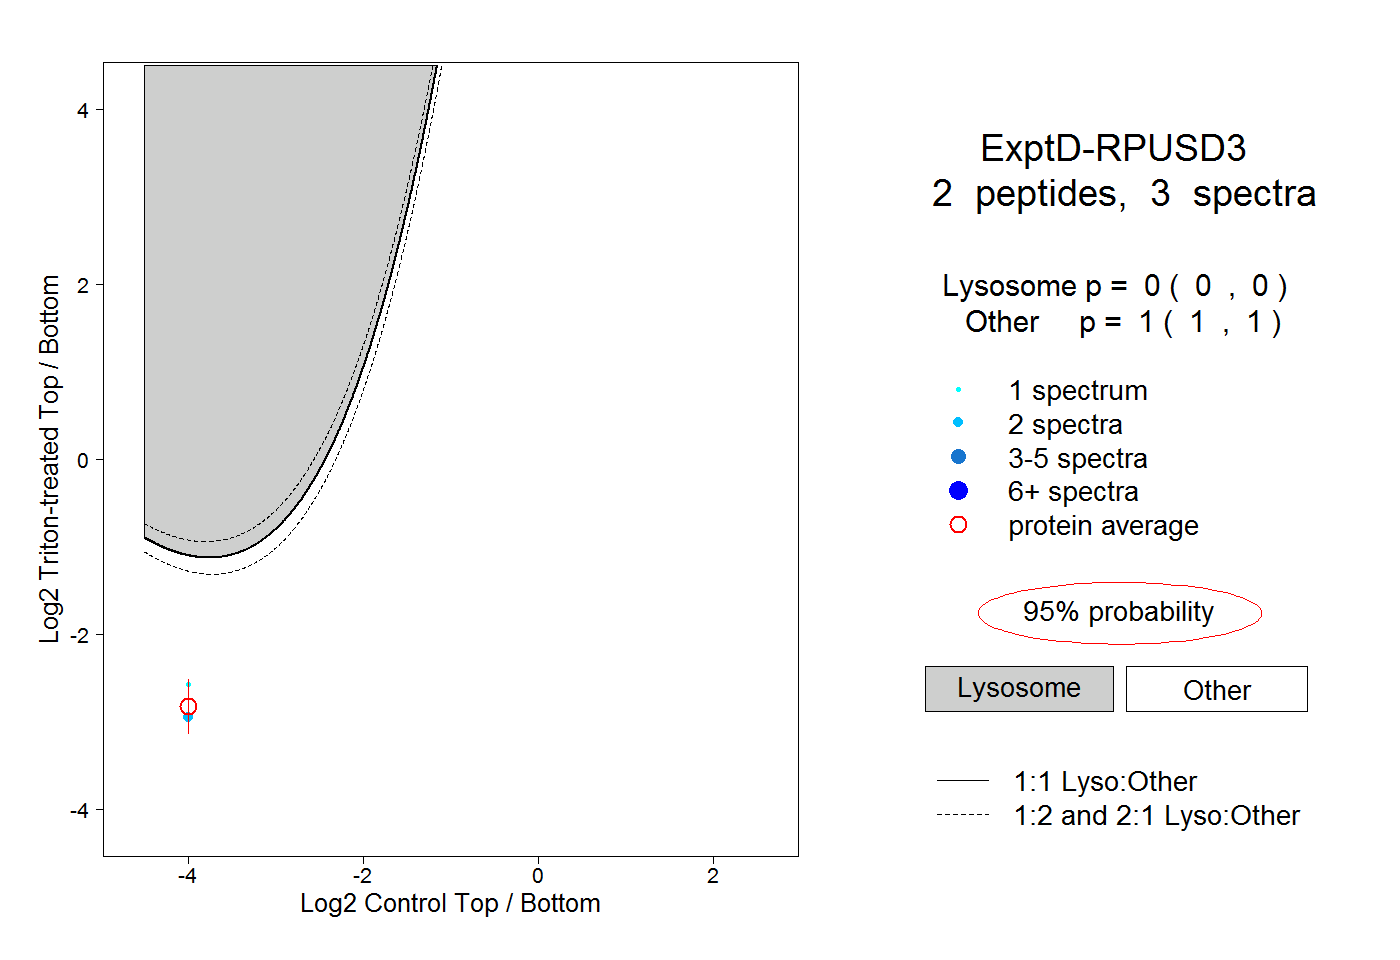
0.000 | 0.000
1.000 | 1.000