5
5peptides
spectra
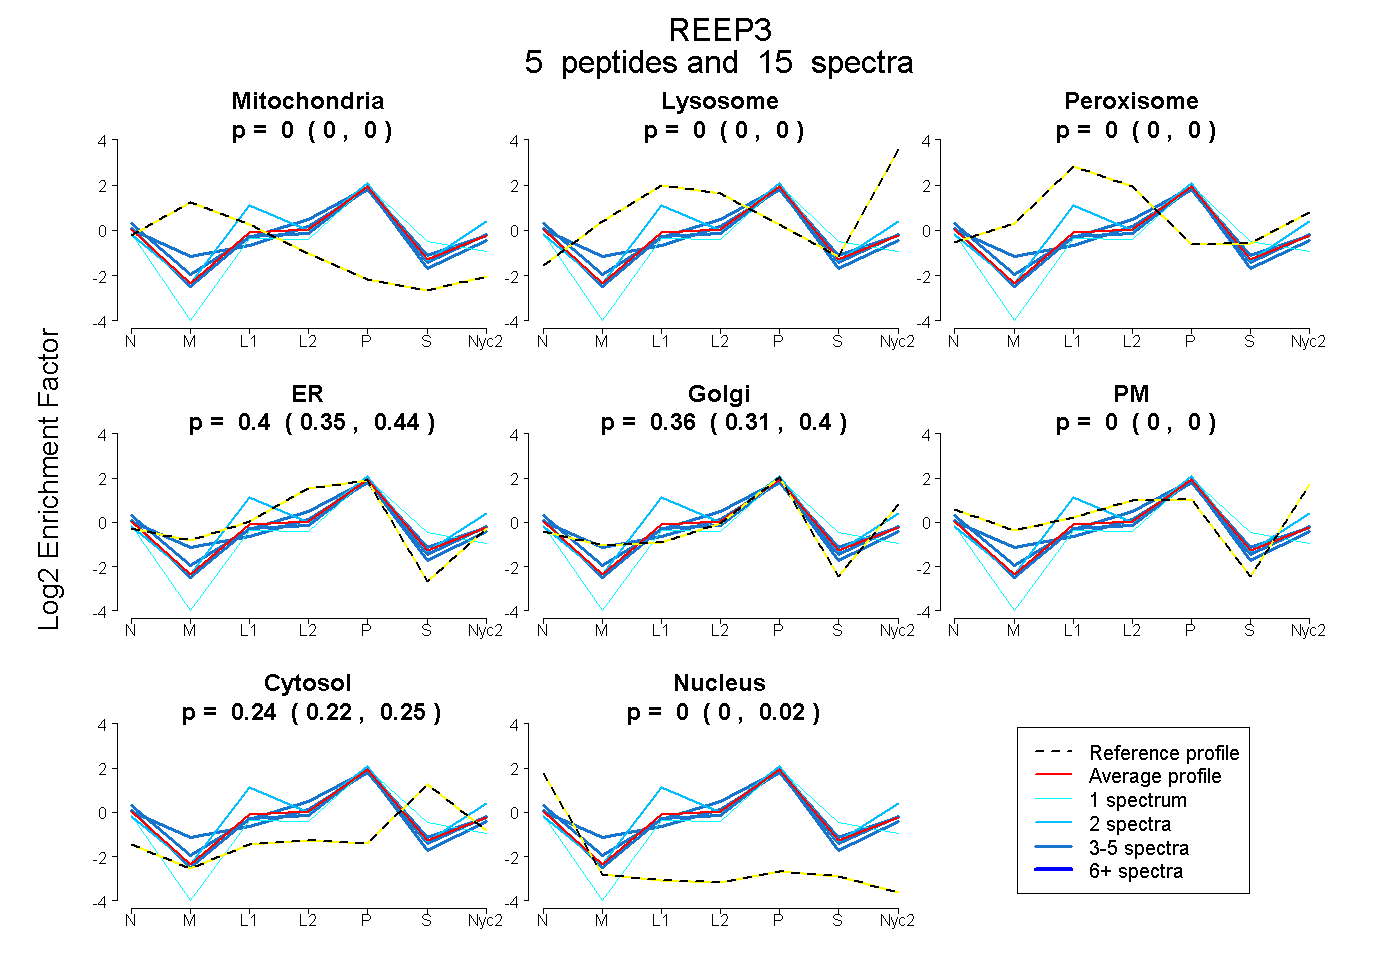
0.000 | 0.000
0.000 | 0.000
0.000 | 0.000
0.355 | 0.437
0.309 | 0.398
0.000 | 0.000
0.218 | 0.248
0.000 | 0.015
5peptides
spectra
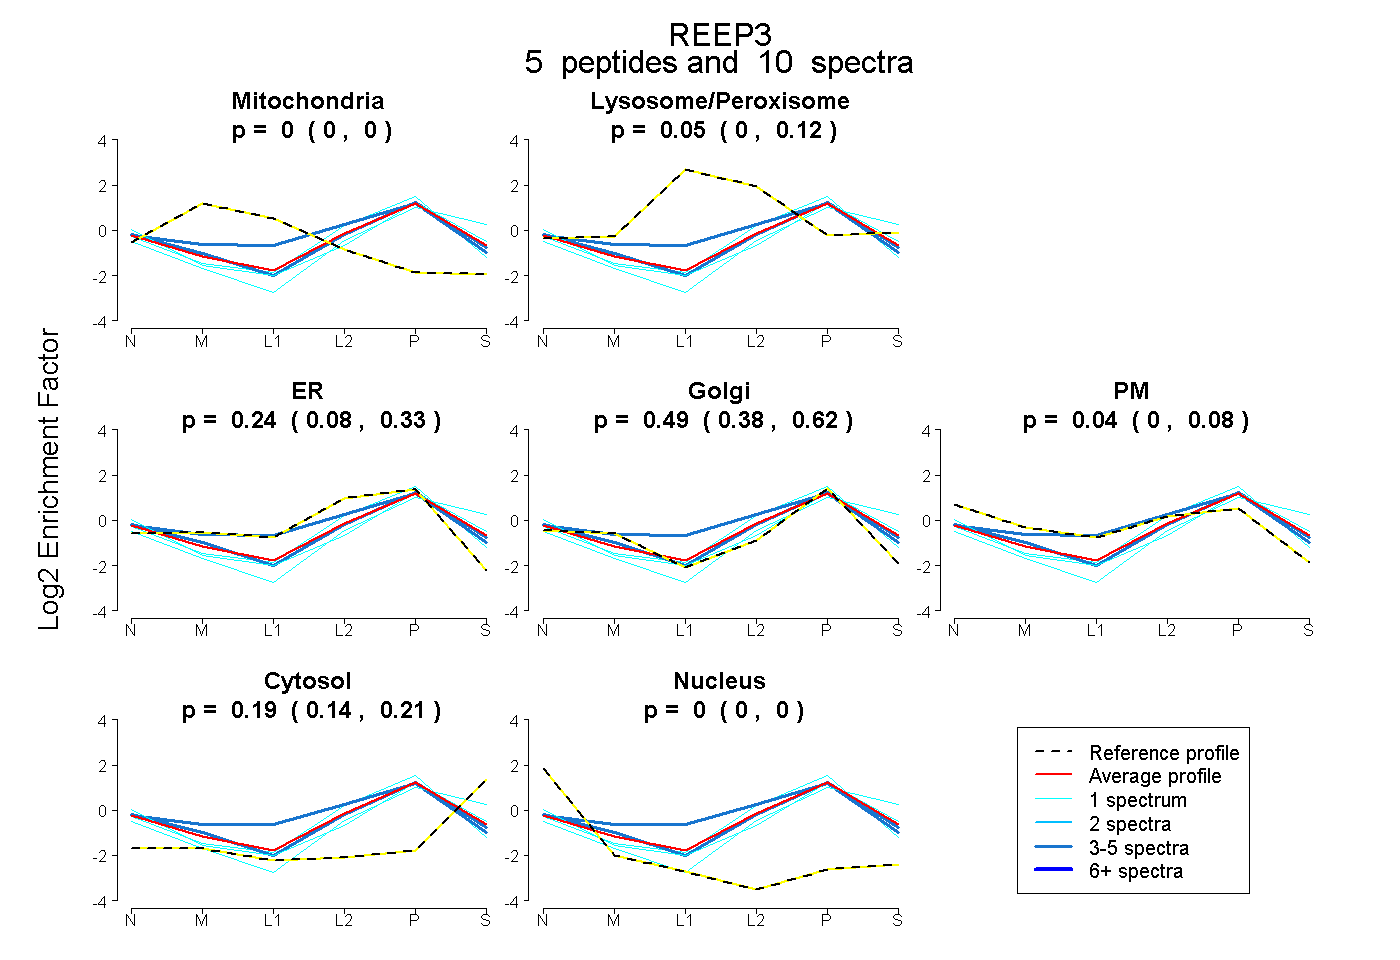
0.000 | 0.000
0.000 | 0.124
0.081 | 0.331
0.384 | 0.616
0.000 | 0.080
0.141 | 0.213
0.000 | 0.000